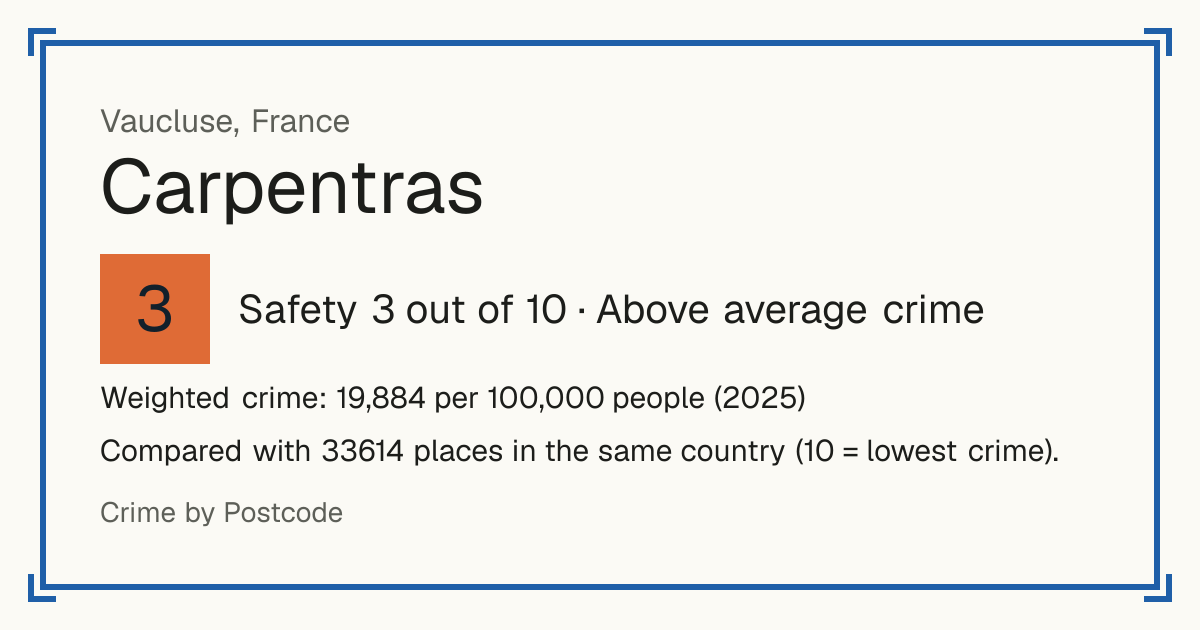
Carpentras, France: crime rate and Safety score
Safety 3 out of 10 Above average crime
3/10 in France · 7/10 in the world
Compared with 33614 places in the same country (10 = lowest crime). 1255 places were left out of the comparison (incomplete figures or very few residents).
Weighted crime: 19,884 per 100,000 people (2025)
Crime by type, as recorded by SSMSI (Ministère de l'Intérieur) (2025)
| Type | Count | Per 100,000 a year | All places this source covers |
|---|---|---|---|
| Sexual offences | |||
| Sexual violence | 55 | 173.9 | 193.3 |
| Counts victims, not offences. | |||
| Violence | |||
| Domestic physical violence | 122 | 385.8 | 375.5 |
| Counts victims, not offences. | |||
| Physical violence outside the family | 130 | 411.1 | 315.6 |
| Counts victims, not offences. | |||
| Robbery | |||
| Armed robbery | not published | - | 11.6 |
| Violent theft without a weapon | 18 | 56.9 | 72 |
| Theft and burglary | |||
| Theft from people without violence | 247 | 781.2 | 910.1 |
| Counts victims who reported it, not offences. | |||
| Home burglary | 87 | 275.2 | 309.6 |
| Vehicle theft | 46 | 145.5 | 182.6 |
| Counts vehicles, not offences. | |||
| Theft from vehicles | 89 | 281.5 | 341.5 |
| Counts vehicles, not offences. | |||
| Theft of vehicle parts | 26 | 82.2 | 139.4 |
| Counts vehicles, not offences. | |||
| Drugs | |||
| Drug use | 318 | 1,005.7 | 453.9 |
| Counts people implicated, not offences; on-the-spot drug fines are not included. | |||
| Drug trafficking | 96 | 303.6 | 84.8 |
| Counts people implicated, not offences. | |||
| Damage and public order | |||
| Deliberate damage | 473 | 1,495.9 | 788.7 |
| Other | |||
| Fraud and payment card fraud | 224 | 708.4 | 651.7 |
| Counts victims, in the commune where the victim lives, not where the fraud happened. | |||
Source: SSMSI (Ministère de l'Intérieur), updated 28 October 2026.
Recorded crime by type (2025)
| Sexual offences | 55 |
|---|---|
| Violence | 252 |
| Robbery | not published |
| Theft and burglary | 495 |
| Drugs | 414 |
| Damage and public order | 473 |
| Other | 224 |
Questions about crime in Carpentras
- Is Carpentras safe?
- Carpentras: Safety 3 out of 10 (Above average crime). Compared with 33614 places in the same country (10 = lowest crime). 1255 places were left out of the comparison (incomplete figures or very few residents).
- What is the crime rate in Carpentras?
- Carpentras: Weighted crime: 19,884 per 100,000 people (2025).
Living
10/10 Living 10 out of 10, compared with other places in the same country.
Raw score 9.1 out of 10, before ranking.
- Schools: 10/10
- Transport: 8/10
- Health: 9/10
- Supermarkets: 9/10
Nearest places
- School: Collège Marie Pila 210 m
- School: Lycée professionnel privé Les Chênes 350 m
- School: Section d'enseignement professionnel du Lycée polyvalent Jean Henri Fabre 420 m
- School: Lycée polyvalent Jean Henri Fabre 480 m
- School: Collège Jean Henri Fabre 530 m
- Bus stop: Marie Pila 210 m
- Bus stop: Marie Pila 220 m
- Bus stop: Marie Pila 220 m
- Railway station: Carpentras 2.0 km
- Doctor or clinic: Forgerot 650 m
- A&E: Centre hospitalier de Carpentras 3.0 km
- Supermarket: Biocoop 920 m
- Supermarket: Intermarché 980 m
Schools count by distance only: there are no inspection grades to use.
Other places nearby
- Aubignan 8/10
- Mazan 7/10
- Monteux 5/10
- Pernes-les-Fontaines 7/10
- Sarrians 8/10
- Entraigues-sur-la-Sorgue 7/10
- Bédarrides 4/10
- Jonquières 8/10
Mayors of Carpentras since 2014
Carpentras: Far right. Département president: Dominique Santoni (Union of the right)
Hervé DE LÉPINAU · Far right
since March 2026
Too early to compare
Serge ANDRIEU · Other left
July 2020 – March 2026
excludes types not published for this commune
Carpentras ▲ +16% · France ▲ +5%
Recorded crime per 1,000 people, the year before taking office vs the latest year in office
Serge ANDRIEU
June 2018 – July 2020
changed during 2014–2020; date unknown
Francis ADOLPHE · Union of the left
about March 2014 – date unknown
changed during 2014–2020; date unknown
Maires: Répertoire national des élus and Ministère de l'Intérieur election results. Crime: SSMSI. Licence Ouverte v2.0. Maires 2014: Ministère de l'Intérieur via IdeesLibres (ODbL).