Crime in East Lindsey
Recorded crime in East Lindsey is about the England and Wales average. Over 5 years it has fallen 2%. Most of the harm comes from violence and sexual offences (assaults, harassment, sexual offences). Police data to August 2026.
145,183 residents in 82 neighbourhoods.
- Safety in the UK
- 4/10Above average crime
- Safety in the world
- 7/10Low crime
- Living
- 4.5/10Fair
- 5-year change
- −2%fewer crimes
Crime over 5 years
Down 2% in 5 years Recorded crimes in East Lindsey, anti-social behaviour left out.
What is recorded
Crime severity: about the England and Wales average. 71 recorded crimes per 1,000 residents a year.
- Violence and sexual offences (assaults, harassment, sexual offences): 65% of the harm here
- Burglary: 18% of the harm here
- Other theft: 4% of the harm here
"Violence and sexual offences" is 65% of the harm here. It is a broad police category: most of these crimes are assaults without injury, harassment and threats, often indoors between people who know each other, and only a small part are sexual or serious violent offences. Police data does not say which, so each one is weighted at the England and Wales average for the category, which can overstate a quiet residential area.
Anti-social behaviour: 21 incidents per 1,000 residents a year, not scored. Not a crime, so it is not part of the Safety score.
Crime by type
Recorded crimes per 1,000 residents per year, most serious first, not counting anti-social behaviour.
| Type | Per 1,000 a year |
|---|---|
| Robbery | 0.4 |
| Burglary | 5.7 |
| Violence and sexual offences (assaults, harassment, sexual offences) | 31.9 |
| Drugs | 1.9 |
| Possession of weapons (knives and other weapons) | 0.7 |
| Other crime | 1.8 |
| Other theft | 6.4 |
| Theft from the person (pickpocketing, bag snatching) | 0.3 |
| Vehicle crime (cars stolen and broken into) | 2.9 |
| Criminal damage and arson (vandalism) | 8.0 |
| Public order | 5.0 |
| Bicycle theft | 0.6 |
| Shoplifting | 5.5 |
What crimes are recorded in East Lindsey
71.0 crimes per 1,000 residents were recorded in East Lindsey in 2025/26 (England and Wales: 83.2).
Our total for April 2025 to March 2026: 10,347. Home Office recorded crime: 10,304 (0% apart).
Crimes recorded by the police, April 2025 to March 2026. Source: Home Office, police recorded crime by community safety partnership.
| Type | Crimes in 2025/26 | Per 1,000 residents | Change on 2024/25 |
|---|---|---|---|
| Cars stolen | 171 | 1.2 | Down 7% |
| Cars broken into | 120 | 0.83 | Down 37% |
| Vehicle tampering | 45 | 0.31 | Down 35% |
| Vandalism to homes | 220 | 1.5 | Up 13% |
| Vandalism to other buildings | 102 | 0.70 | Down 6% |
| Vandalism to vehicles | 264 | 1.8 | Down 8% |
| Arson | 91 | 0.63 | Up 72% |
| Burglary of homes | 198 | 1.4 | About the same |
| Burglary of businesses | 164 | 1.1 | Down 6% |
| Homicide (murder and manslaughter) | 2 | - | - |
| Carrying a knife or blade | 37 | 0.25 | Up 23% |
| Carrying other weapons (including guns) | 52 | 0.36 | Up 44% |
| Robbery of people | 38 | 0.26 | Down 25% |
| Robbery of businesses | 32 | 0.22 | - |
| Violence with injury | 1,487 | 10.2 | Up 3% |
| Violence without injury | 1,774 | 12.2 | Down 5% |
| Stalking and harassment | 1,314 | 9.1 | Up 7% |
| Sexual offences | 537 | 3.7 | Up 10% |
| Shoplifting | 1,042 | 7.2 | Up 23% |
| Bicycle theft | 39 | 0.27 | Down 33% |
| Theft from the person (pickpocketing, bag snatching) | 26 | 0.18 | Up 13% |
| Drug dealing | 63 | 0.43 | About the same |
| Drug possession | 148 | 1.0 | Down 22% |
Under 10 a year: no rate or change, the numbers are too small to compare. These are council-area figures: police.uk street-level data, used for the map and the Safety score, only has the broad categories, and no source publishes murders or stabbings by street.
Lincolnshire Police area: 431 offences involving a knife or sharp instrument in 2025/26 (404 the year before). This covers the whole police force area, not only East Lindsey.
Source: Home Office, police recorded knife crime by police force.
Police and Crime Commissioner: Marc Jones (Lincolnshire) →
How often crimes lead to a charge
In East Lindsey, 10% of crimes reported between September 2024 and August 2025 led to someone being charged or summonsed (England and Wales: 9%).
- Charged or summonsed
- Caution or other action
- Suspect found, not prosecuted
- No suspect identified
- Still open
Show as a table
| Type | Crimes | Charged or summonsed | Caution or other action | Suspect found, not prosecuted | No suspect identified | Still open |
|---|---|---|---|---|---|---|
| Violence and sexual offences (assaults, harassment, sexual offences) | 5,138 | 7% | 6% | 71% | 13% | 4% |
| Shoplifting | 1,057 | 28% | 2% | 13% | 57% | 0% |
| Criminal damage and arson (vandalism) | 1,024 | 5% | 4% | 32% | 57% | 1% |
| Other theft | 832 | 3% | 1% | 26% | 68% | 2% |
| Public order | 593 | 10% | 3% | 60% | 24% | 3% |
| Burglary | 523 | 7% | 0% | 14% | 78% | 1% |
| Vehicle crime (cars stolen and broken into) | 411 | 18% | 0% | 16% | 64% | 2% |
| Other crime | 356 | 6% | 11% | 63% | 12% | 8% |
| Drugs | 268 | 33% | 21% | 35% | 7% | 4% |
| Possession of weapons (knives and other weapons) | 97 | 33% | 7% | 48% | 3% | 8% |
| Robbery | 57 | 7% | 2% | 47% | 40% | 4% |
| Bicycle theft | 52 | 2% | 2% | 23% | 73% | 0% |
Uses the latest outcome police have recorded so far. 3% of these crimes are still open, so the final figures may be a little higher.
Road collisions
East Lindsey, 2023 to 2025: 381 road collisions a year with someone hurt, 119 of them with someone killed or seriously injured. 40 collisions were fatal in those 3 years.
2.6 a year per 1,000 residents (Great Britain 1.5). 31% of them killed or seriously injured someone (Great Britain 26%).
Collisions on public roads that the police recorded where someone was hurt, counted where they happened, so busy through roads and town centres with few residents come out high. Serious and slight use the Department for Transport's adjusted severity, comparable between police forces. Source: Department for Transport road casualty statistics (STATS19), Open Government Licence v3.0.
Towns and cities in East Lindsey
Postcode districts in East Lindsey
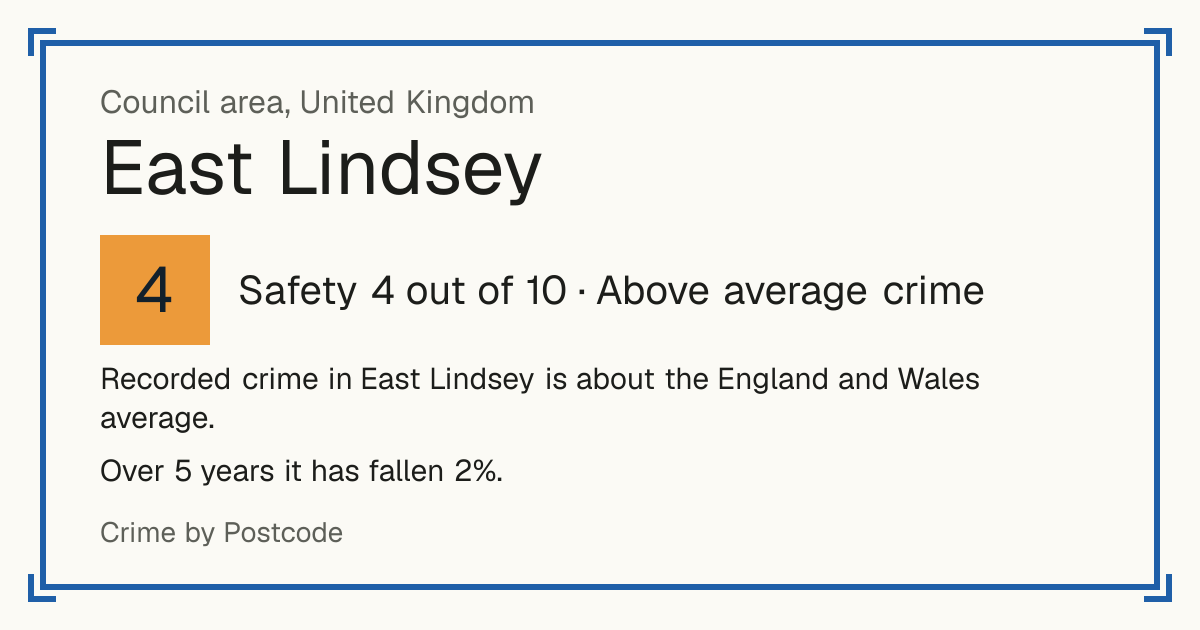
Embed this on your site: a free live safety card for East Lindsey.
Questions about crime in East Lindsey
- Is East Lindsey a safe place to live?
- East Lindsey scores 4 out of 10 for safety (above average crime), compared with every neighbourhood in England, Wales and Northern Ireland.
- Is crime going up or down in East Lindsey?
- Down 2% over 5 years, from 11,346 recorded crimes a year to 11,149.
- What is the most common crime in East Lindsey?
- The most common recorded crime is violence and sexual offences (assaults, harassment, sexual offences), about 32 per 1,000 residents a year.
- How often does crime lead to a charge in East Lindsey?
- In East Lindsey, 10% of crimes reported between September 2024 and August 2025 led to someone being charged or summonsed (England and Wales: 9%). 32% were closed without a suspect being identified.
- How many burglaries are solved in East Lindsey?
- Of 523 burglaries reported in East Lindsey between September 2024 and August 2025, 7% led to someone being charged or summonsed and 78% were closed with no suspect identified.
- How many cars are stolen in East Lindsey?
- In East Lindsey, the police recorded 171 cars stolen in 2025/26 (April 2025 to March 2026), 1.2 per 1,000 residents, down 7% on the year before.
- Is vandalism common in East Lindsey?
- 586 acts of vandalism to homes, other buildings and vehicles were recorded in East Lindsey in 2025/26, 4.0 per 1,000 residents, 0.8 times the England and Wales average.
- How many murders were there in East Lindsey last year?
- 2 homicides (murder or manslaughter) were recorded in East Lindsey in 2025/26, against 3 the year before.