5Brugge
Brugge, Belgium: crime rate and Safety score
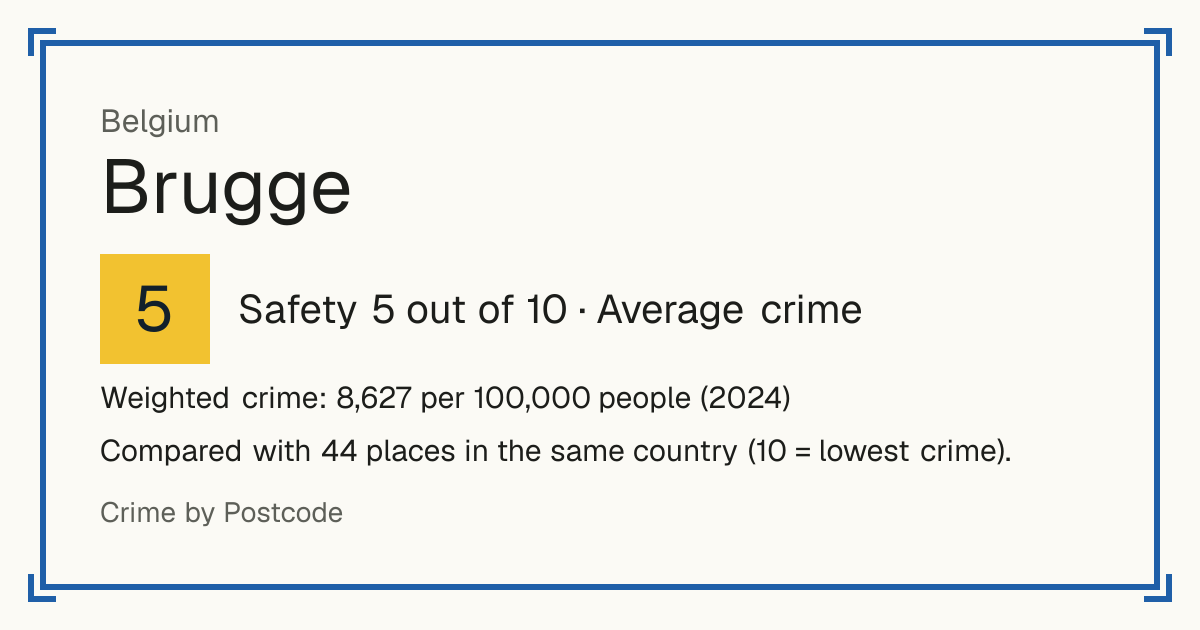
Safety 5 out of 10 Average crime
5/10 in Belgium · 7/10 in the world
Compared with 44 places in the same country (10 = lowest crime).
Weighted crime: 8,627 per 100,000 people (2024)
Crime by type, as recorded by Eurostat / national police (2024)
| Type | Count | Per 100,000 a year | All places this source covers |
|---|---|---|---|
| Homicide | |||
| Intentional homicide | 1 | 0.3 | 1.8 |
| Violence | |||
| Assault | 1,407 | 489.7 | 416.4 |
| Robbery | |||
| Robbery | 93 | 32.4 | 24 |
| Theft and burglary | |||
| Burglary of homes | 581 | 202.2 | 67.4 |
| Other burglary | 202 | 70.3 | 78.8 |
| Motor vehicle theft | 137 | 47.7 | 20.3 |
| Other theft | 4,017 | 1,398 | 322.3 |
Source: Eurostat / national police, updated 26 October 2026.
Recorded crime by type (2024)
| Homicide | 1 |
|---|---|
| Violence | 1,407 |
| Robbery | 93 |
| Theft and burglary | 4,937 |
Living
5/10 Living 5 out of 10: the average of the places in it, on their scale.
Raw score 7.3 out of 10, before ranking.
Places in Brugge
- Beernem 5/10
- Blankenberge 1/10
- Brugge 1/10
- Damme 10/10
- Jabbeke 10/10
- Knokke-Heist 1/10
- Oostkamp 10/10
- Torhout 5/10
- Zedelgem 10/10
- Zuienkerke 2/10