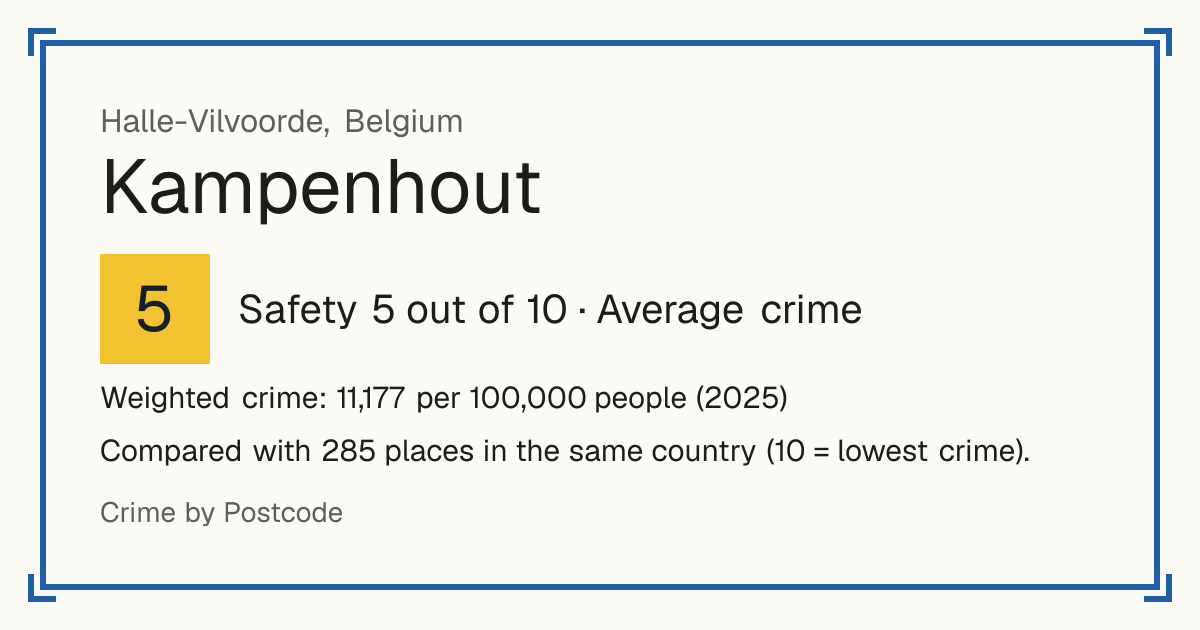
5Kampenhout
Kampenhout, Belgium: crime rate and Safety score
Safety 5 out of 10 Average crime
5/10 in Belgium · 8/10 in the world
Compared with 285 places in the same country (10 = lowest crime).
Weighted crime: 11,177 per 100,000 people (2025)
Crime by type, as recorded by Federal Police (2025)
| Type | Count | Per 100,000 a year | All places this source covers |
|---|---|---|---|
| Homicide | |||
| Murder | 1 | 7.9 | 2.1 |
| Attempts included (one record per police report, completed or attempted). | |||
| Manslaughter | 1 | 7.9 | 9.1 |
| Attempts included. | |||
| Violence | |||
| Assault within the family | 11 | 87.3 | 206.1 |
| Assault outside the family | 22 | 174.5 | 347.5 |
| Failure to help a person in danger | 1 | 7.9 | 1.8 |
| Other intentional offences against the person | 1 | 7.9 | 30.8 |
| All offences against physical integrity less the lines above; also female genital mutilation and breaches of international humanitarian law. | |||
| Unintentional injury or death | 1 | 7.9 | 14.3 |
| Torture and ill-treatment | 0 | 0 | 2.1 |
| Robbery | |||
| Armed robbery | 0 | 0 | 9.7 |
| Robbery without a weapon | 8 | 63.5 | 66.6 |
| Theft and burglary | |||
| Car theft | 3 | 23.8 | 24.4 |
| Bicycle theft | 21 | 166.6 | 263.8 |
| Theft from a vehicle | 30 | 238 | 136.8 |
| Shoplifting | 10 | 79.3 | 211 |
| Home burglary | 23 | 182.5 | 218.2 |
| Pickpocketing | 3 | 23.8 | 45.3 |
| Bag snatching | 0 | 0 | 0.8 |
| Other theft and extortion | 47 | 372.8 | 576.1 |
| All theft and extortion less the theft and robbery lines above. | |||
| Drugs | |||
| Drug possession | 16 | 126.9 | 386.8 |
| Drug dealing | 1 | 7.9 | 69.1 |
| Drug use | 0 | 0 | 16.8 |
| Other drug offences | 2 | 15.9 | 38.9 |
| Damage and public order | |||
| Damage to property | 57 | 452.2 | 513.6 |
| Drunkenness and alcohol | 5 | 39.7 | 191.5 |
| Other | |||
| Fraud | 129 | 1,023.3 | 620.2 |
| Offences against morals | 52 | 412.5 | 298.6 |
| Includes sexual offences, which are not published separately by gemeente: sexual offences have no figure of their own. | |||
| Immigration law | 9 | 71.4 | 235 |
| Offences against public safety | 26 | 206.3 | 249.9 |
| Population register offences | 9 | 71.4 | 166.1 |
| Computer crime | 70 | 555.3 | 618.7 |
| Public health offences | 0 | 0 | 11.3 |
| Forgery and offences against public trust | 8 | 63.5 | 110.3 |
| Weapons and explosives | 9 | 71.4 | 97.1 |
| Youth protection | 51 | 404.6 | 255.7 |
| Other offences | 48 | 380.8 | 527.9 |
Source: Federal Police, updated 29 October 2026.
Recorded crime by type (2025)
| Homicide | 2 |
|---|---|
| Violence | 36 |
| Robbery | 8 |
| Theft and burglary | 137 |
| Drugs | 19 |
| Damage and public order | 62 |
| Other | 411 |
Questions about crime in Kampenhout
- Is Kampenhout safe?
- Kampenhout: Safety 5 out of 10 (Average crime). Compared with 285 places in the same country (10 = lowest crime).
- What is the crime rate in Kampenhout?
- Kampenhout: Weighted crime: 11,177 per 100,000 people (2025).
- How many murders are there in Kampenhout?
- Recorded homicides in Kampenhout (2025): 2.
Living
5/10 Living 5 out of 10, compared with other places in the same country.
Raw score 7.3 out of 10, before ranking.
- Schools: 10/10
- Transport: 2/10
- Health: 8/10
- Supermarkets: 9/10
Nearest places
- School: GO! basisschool Spectrum 380 m
- School: De Boomhut 910 m
- School: De Toverberg 1.6 km
- School: Gemeenteschool Het Klimtouw 1.6 km
- School: Vrije Kleuterschool 't Okkerzeeltje 1.9 km
- Railway station: Erps-Kwerps 4.8 km
- Doctor or clinic: Lamanterveld 1.2 km
- A&E: Imelda Ziekenhuis 9.3 km
- Supermarket: AD Delhaize 700 m
- Supermarket: Spar 1.0 km
Schools count by distance only: there are no inspection grades to use.