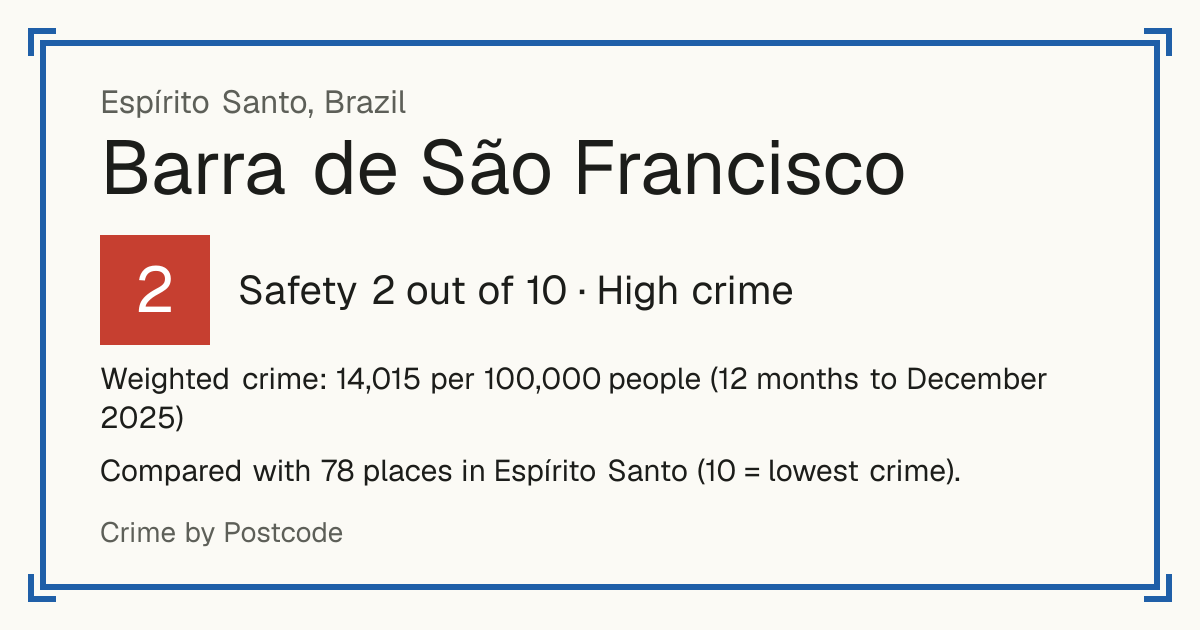
2Barra de São Francisco
Barra de São Francisco, Brazil: crime rate and Safety score
Safety 2 out of 10 High crime
2/10 in Espírito Santo · 1/10 in the world
Compared with 78 places in Espírito Santo (10 = lowest crime).
Weighted crime: 14,015 per 100,000 people (12 months to December 2025)
Crime by type, as recorded by SESP-ES (12 months to December 2025)
| Type | Count | Per 100,000 a year | All places this source covers |
|---|---|---|---|
| Homicide | |||
| Intentional homicide | 12 | 28.2 | 19.9 |
| Counted in victims, not cases. | |||
| Femicide | 0 | 0 | 0.9 |
| Counted in victims, not cases. | |||
| Violence | |||
| Domestic violence | 369 | 868.3 | 629.7 |
| Cases under the Maria da Penha law (threats, assaults and other offences against women at home). | |||
| Robbery | |||
| Street robbery | 5 | 11.8 | 216.1 |
| Robbery on public transport | 0 | 0 | 18.9 |
| Robbery of a shop or business | 4 | 9.4 | 9.8 |
| Robbery in a home | 2 | 4.7 | 4.9 |
| Vehicle robbery | 5 | 11.8 | 36.3 |
| Vehicle robberies not already counted under the types above (in the street, on public transport, in a shop, at home). | |||
| Phone robbery | 3 | 7.1 | 31.9 |
| Phone robberies not already counted under the types above (in the street, on public transport, in a shop, at home). | |||
| Bicycle robbery | 0 | 0 | 5.4 |
| Bicycle robberies not already counted under the types above (in the street, on public transport, in a shop, at home). | |||
| Theft and burglary | |||
| Theft from a person in the street | 11 | 25.9 | 87.1 |
| Theft on public transport | 0 | 0 | 63.9 |
| Theft from a shop or business | 51 | 120 | 104.7 |
| Theft from a home | 67 | 157.7 | 105.1 |
| Vehicle theft | 33 | 77.7 | 98.1 |
| Vehicle thefts not already counted under the types above (in the street, on public transport, in a shop, at home). | |||
| Phone theft | 27 | 63.5 | 108.2 |
| Phone thefts not already counted under the types above (in the street, on public transport, in a shop, at home). | |||
| Bicycle theft | 16 | 37.6 | 50.5 |
| Bicycle thefts not already counted under the types above (in the street, on public transport, in a shop, at home). | |||
| Other | |||
| Fraud | 491 | 1,155.3 | 1,368.1 |
| Cybercrime | 13 | 30.6 | 69.6 |
| Cases not already counted as fraud. | |||
Source: SESP-ES, updated 29 October 2026.
Recorded crime by type (12 months to December 2025)
| Homicide | 12 |
|---|---|
| Violence | 369 |
| Robbery | 19 |
| Theft and burglary | 205 |
| Other | 504 |
Questions about crime in Barra de São Francisco
- Is Barra de São Francisco safe?
- Barra de São Francisco: Safety 2 out of 10 (High crime). Compared with 78 places in Espírito Santo (10 = lowest crime).
- What is the crime rate in Barra de São Francisco?
- Barra de São Francisco: Weighted crime: 14,015 per 100,000 people (12 months to December 2025).
- How many murders are there in Barra de São Francisco?
- Recorded homicides in Barra de São Francisco (12 months to December 2025): 12.