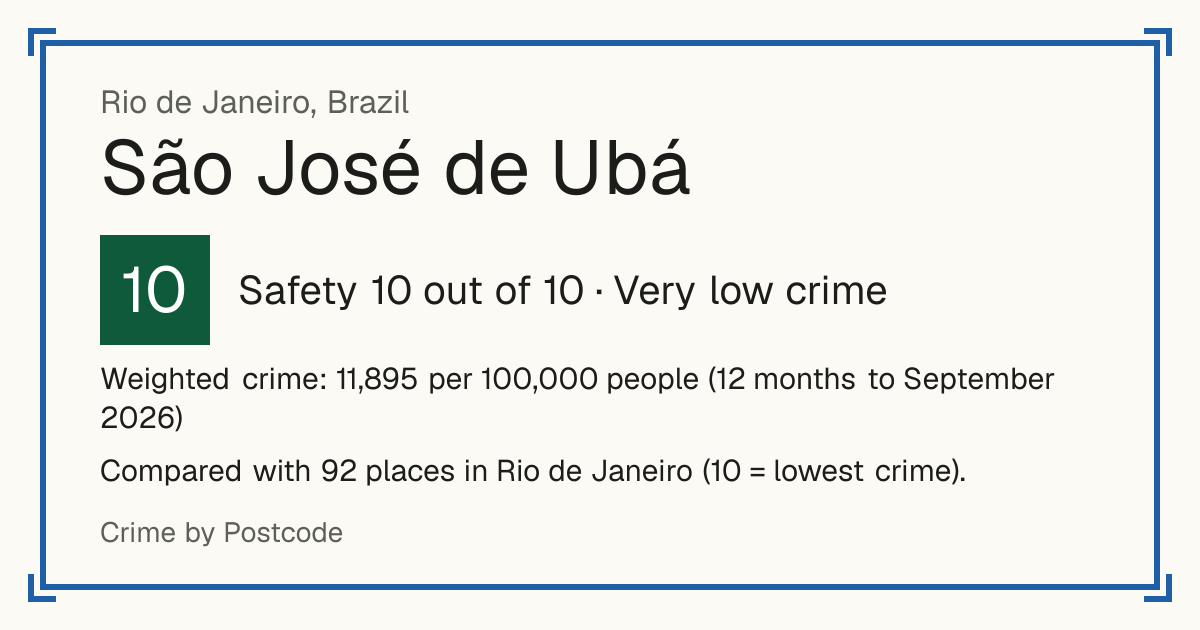
10São José de Ubá
São José de Ubá, Brazil: crime rate and Safety score
Safety 10 out of 10 Very low crime
10/10 in Rio de Janeiro · 2/10 in the world
Compared with 92 places in Rio de Janeiro (10 = lowest crime).
Weighted crime: 11,895 per 100,000 people (12 months to September 2026)
Crime by type, as recorded by ISP-RJ (12 months to September 2026)
| Type | Count | Per 100,000 a year | All places this source covers |
|---|---|---|---|
| Homicide | |||
| Intentional homicide | 4 | 56.6 | 16.7 |
| Counted in victims, not cases. | |||
| Femicide | 0 | 0 | 0.7 |
| Counted in victims, not cases. | |||
| Robbery resulting in death | 1 | 14.1 | 0.5 |
| Counted in victims, not cases. | |||
| Assault resulting in death | 0 | 0 | 0.3 |
| Counted in victims, not cases. | |||
| Sexual offences | |||
| Rape | 1 | 14.1 | 38.4 |
| Counted in victims, not cases. | |||
| Violence | |||
| Attempted homicide | 2 | 28.3 | 22.3 |
| Attempts only; counted in victims. | |||
| Attempted femicide | 0 | 0 | 2.1 |
| Attempts only; counted in victims. | |||
| Assault causing injury | 12 | 169.7 | 426.2 |
| Counted in victims, not cases. | |||
| Kidnapping for ransom | 0 | 0 | 0 |
| Counted in victims, not cases. | |||
| Threats | 8 | 113.2 | 484 |
| Counted in victims, not cases. | |||
| Robbery | |||
| Street robbery | 0 | 0 | 149.2 |
| Mobile phone robbery | 0 | 0 | 134.9 |
| Robbery on public transport | 0 | 0 | 16 |
| Vehicle robbery | 1 | 14.1 | 161 |
| Cargo robbery | 0 | 0 | 19.2 |
| Robbery of a shop or business | 0 | 0 | 13.8 |
| Home robbery | 0 | 0 | 3.9 |
| Cash machine robbery | 0 | 0 | 0.1 |
| Robbery forcing the victim to withdraw cash | 0 | 0 | 0.1 |
| Robbery after a cash withdrawal | 0 | 0 | 0.7 |
| Bicycle robbery | 0 | 0 | 1.5 |
| Other robbery | 2 | 28.3 | 66.5 |
| Includes the robberies that ended in a death (whose victims are also counted under robbery resulting in death). | |||
| Express kidnapping | 0 | 0 | 1 |
| Counted in victims, not cases. | |||
| Extortion | 0 | 0 | 28.8 |
| Theft and burglary | |||
| Vehicle theft | 2 | 28.3 | 98.5 |
| Theft from a person | 0 | 0 | 92.3 |
| Theft on public transport | 0 | 0 | 46.4 |
| Mobile phone theft | 0 | 0 | 251.7 |
| Bicycle theft | 1 | 14.1 | 25.5 |
| Other theft | 8 | 113.2 | 571.7 |
| Drugs | |||
| Drug seizures | 15 | 212.2 | 170.5 |
| Police records of drug possession, dealing or seizure, one per record. | |||
| Other | |||
| Fraud | 25 | 353.6 | 1,002.4 |
Source: ISP-RJ, updated 29 October 2026.
Recorded crime by type (12 months to September 2026)
| Homicide | 5 |
|---|---|
| Sexual offences | 1 |
| Violence | 22 |
| Robbery | 3 |
| Theft and burglary | 11 |
| Drugs | 15 |
| Other | 25 |
Questions about crime in São José de Ubá
- Is São José de Ubá safe?
- São José de Ubá: Safety 10 out of 10 (Very low crime). Compared with 92 places in Rio de Janeiro (10 = lowest crime).
- What is the crime rate in São José de Ubá?
- São José de Ubá: Weighted crime: 11,895 per 100,000 people (12 months to September 2026).
- How many murders are there in São José de Ubá?
- Recorded homicides in São José de Ubá (12 months to September 2026): 5.