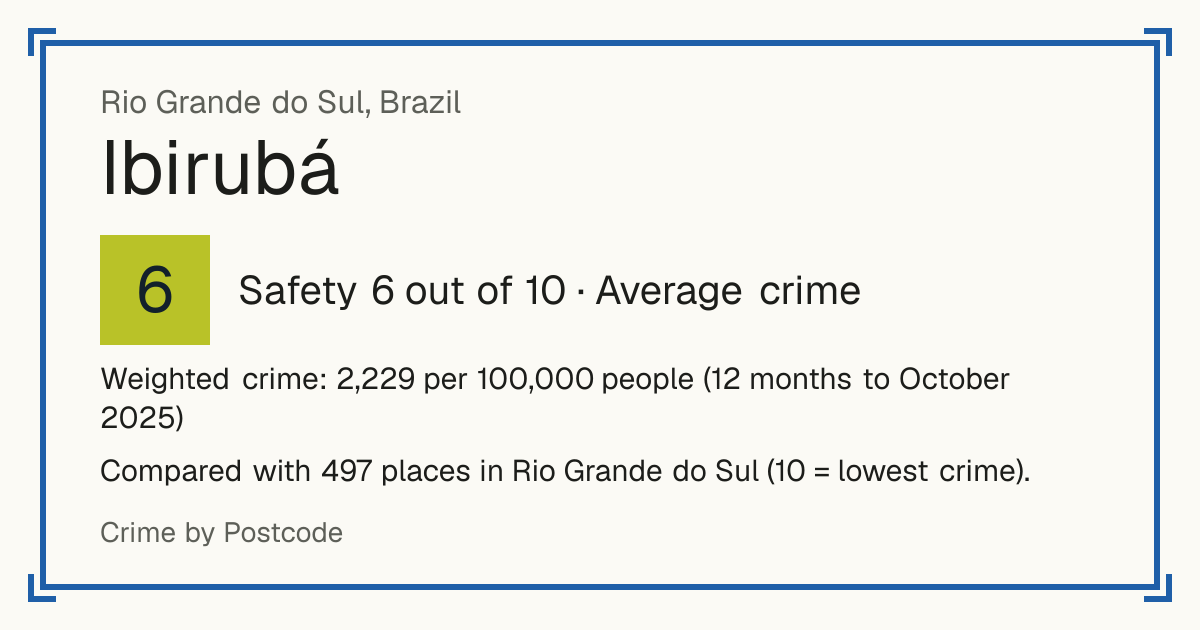
6Ibirubá
Ibirubá, Brazil: crime rate and Safety score
Safety 6 out of 10 Average crime
6/10 in Rio Grande do Sul · 2/10 in the world
Compared with 497 places in Rio Grande do Sul (10 = lowest crime).
Weighted crime: 2,229 per 100,000 people (12 months to October 2025)
Crime by type, as recorded by SSP-RS (12 months to October 2025)
| Type | Count | Per 100,000 a year | All places this source covers |
|---|---|---|---|
| Homicide | |||
| Intentional homicide | 1 | 4.6 | 10 |
| Counted in victims, not cases. | |||
| Robbery resulting in death | 0 | 0 | 0.2 |
| Counted in victims, not cases. | |||
| Assault resulting in death | 0 | 0 | 0.4 |
| Counted in victims, not cases. | |||
| Robbery | |||
| Robbery other than of vehicles | 1 | 4.6 | 176.2 |
| Vehicle robbery | 0 | 0 | 17.8 |
| Theft and burglary | |||
| Theft other than of vehicles | 101 | 468 | 979.6 |
| Includes livestock theft. | |||
| Vehicle theft | 11 | 51 | 59 |
| Drugs | |||
| Drug possession | 22 | 101.9 | 64.6 |
| Drug trafficking | 25 | 115.8 | 164.3 |
| Other | |||
| Fraud | 50 | 231.7 | 727.5 |
| Weapons and ammunition offences | 5 | 23.2 | 52.5 |
Source: SSP-RS, updated 29 October 2026.
Recorded crime by type (12 months to October 2025)
| Homicide | 1 |
|---|---|
| Robbery | 1 |
| Theft and burglary | 112 |
| Drugs | 47 |
| Other | 55 |
Questions about crime in Ibirubá
- Is Ibirubá safe?
- Ibirubá: Safety 6 out of 10 (Average crime). Compared with 497 places in Rio Grande do Sul (10 = lowest crime).
- What is the crime rate in Ibirubá?
- Ibirubá: Weighted crime: 2,229 per 100,000 people (12 months to October 2025).
- How many murders are there in Ibirubá?
- Recorded homicides in Ibirubá (12 months to October 2025): 1.