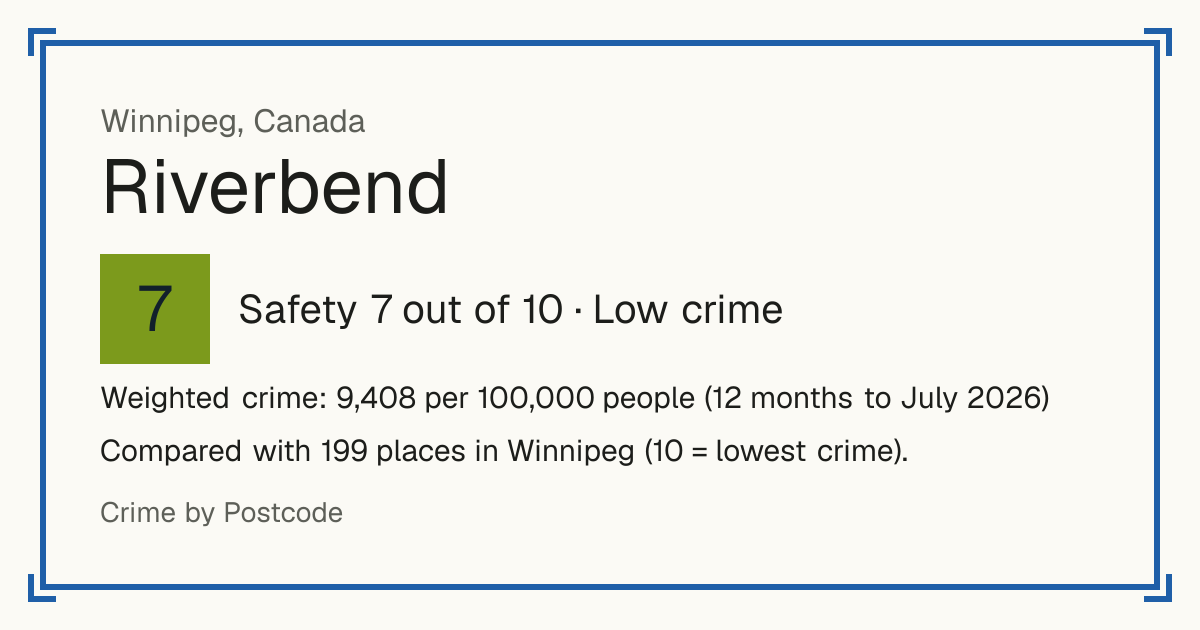
7Riverbend
Riverbend, Canada: crime rate and Safety score
Safety 7 out of 10 Low crime
7/10 in Winnipeg · 7/10 in the world
Compared with 199 places in Winnipeg (10 = lowest crime). 13 places were left out of the comparison (incomplete figures or very few residents).
Weighted crime: 9,408 per 100,000 people (12 months to July 2026)
Residents: 5,453
How accurate: in 2026-07, 88% of the 198 neighbourhoods compared scored within 1 of their 2025-07 score.
Crime by type, as recorded by Winnipeg Police Service (12 months to July 2026)
| Type | Count | Per 100,000 a year | All places this source covers |
|---|---|---|---|
| Homicide | |||
| Homicide | 0 | 0 | 3.9 |
| Counted per victim, as every violent crime in this file (other crimes per incident). | |||
| Sexual offences | |||
| Sexual assault (level 1) | 0 | 0 | 98.7 |
| Counted per victim, as every violent crime in this file (other crimes per incident). | |||
| Sexual assault with a weapon or causing bodily harm (level 2) | 0 | 0 | 2.1 |
| Counted per victim, as every violent crime in this file (other crimes per incident). | |||
| Aggravated sexual assault (level 3) | 0 | 0 | 0.3 |
| Counted per victim, as every violent crime in this file (other crimes per incident). | |||
| Other sexual offences | 1 | 18.3 | 31.5 |
| Counted per victim, as every violent crime in this file (other crimes per incident). | |||
| Violence | |||
| Attempted murder | 0 | 0 | 0.4 |
| Counted per victim, as every violent crime in this file (other crimes per incident). | |||
| Other offences causing death | 0 | 0 | 0.1 |
| Counted per victim, as every violent crime in this file (other crimes per incident). | |||
| Assault (level 1) | 13 | 238.4 | 627.7 |
| Counted per victim, as every violent crime in this file (other crimes per incident). | |||
| Assault with a weapon or causing bodily harm (level 2) | 6 | 110 | 387.7 |
| Counted per victim, as every violent crime in this file (other crimes per incident). | |||
| Aggravated assault (level 3) | 1 | 18.3 | 21.1 |
| Counted per victim, as every violent crime in this file (other crimes per incident). | |||
| Assaults on police officers | 1 | 18.3 | 54.4 |
| Counted per victim, as every violent crime in this file (other crimes per incident). | |||
| Other assaults | 0 | 0 | 1.7 |
| Counted per victim, as every violent crime in this file (other crimes per incident). | |||
| Threats | 8 | 146.7 | 186.5 |
| Counted per victim, as every violent crime in this file (other crimes per incident). | |||
| Criminal harassment | 0 | 0 | 20.1 |
| Counted per victim, as every violent crime in this file (other crimes per incident). | |||
| Threatening or harassing communications | 0 | 0 | 4.1 |
| Counted per victim, as every violent crime in this file (other crimes per incident). | |||
| Kidnapping and forcible confinement | 0 | 0 | 10 |
| Counted per victim, as every violent crime in this file (other crimes per incident). | |||
| Abductions | 0 | 0 | 1.6 |
| Counted per victim, as every violent crime in this file (other crimes per incident). | |||
| Firearm use, discharge or pointing | 0 | 0 | 10.1 |
| Counted per victim, as every violent crime in this file (other crimes per incident). | |||
| Other violent offences | 0 | 0 | 8.4 |
| Counted per victim, as every violent crime in this file (other crimes per incident). | |||
| Robbery | |||
| Robbery | 8 | 146.7 | 315.8 |
| Counted per victim, as every violent crime in this file (other crimes per incident). | |||
| Theft and burglary | |||
| Break and enter | 15 | 275.1 | 532.9 |
| Motor vehicle theft | 7 | 128.4 | 322.2 |
| Theft from a vehicle ($5,000 or under) | 30 | 550.2 | 838.8 |
| Theft from a vehicle (over $5,000) | 0 | 0 | 16.1 |
| Other theft ($5,000 or under) | 2 | 36.7 | 600 |
| Other theft (over $5,000) | 0 | 0 | 27.1 |
| Shoplifting ($5,000 or under) | 3 | 55 | 1,071.2 |
| Shoplifting (over $5,000) | 0 | 0 | 4.1 |
| Drugs | |||
| Cocaine trafficking or production | 0 | 0 | 23.9 |
| Methamphetamine trafficking or production | 0 | 0 | 4 |
| Other drug trafficking or production | 1 | 18.3 | 11.2 |
| Cocaine possession | 0 | 0 | 7.7 |
| Methamphetamine possession | 0 | 0 | 12.5 |
| Other drug possession | 0 | 0 | 17.9 |
| Cannabis offences | 0 | 0 | 0.3 |
| Damage and public order | |||
| Mischief (property damage) | 18 | 330.1 | 1,703 |
| Disturbing the peace | 1 | 18.3 | 2.9 |
| Other | |||
| Weapons offences | 1 | 18.3 | 113.3 |
| Arson | 3 | 55 | 59.9 |
Source: Winnipeg Police Service, updated 28 October 2026.
Recorded crime by type (12 months to July 2026)
| Homicide | 0 |
|---|---|
| Sexual offences | 1 |
| Violence | 29 |
| Robbery | 8 |
| Theft and burglary | 57 |
| Drugs | 1 |
| Damage and public order | 19 |
| Other | 4 |
Questions about crime in Riverbend
- Is Riverbend safe?
- Riverbend: Safety 7 out of 10 (Low crime). Compared with 199 places in Winnipeg (10 = lowest crime). 13 places were left out of the comparison (incomplete figures or very few residents).
- What is the crime rate in Riverbend?
- Riverbend: Weighted crime: 9,408 per 100,000 people (12 months to July 2026).
- How many murders are there in Riverbend?
- Recorded homicides in Riverbend (12 months to July 2026): 0.