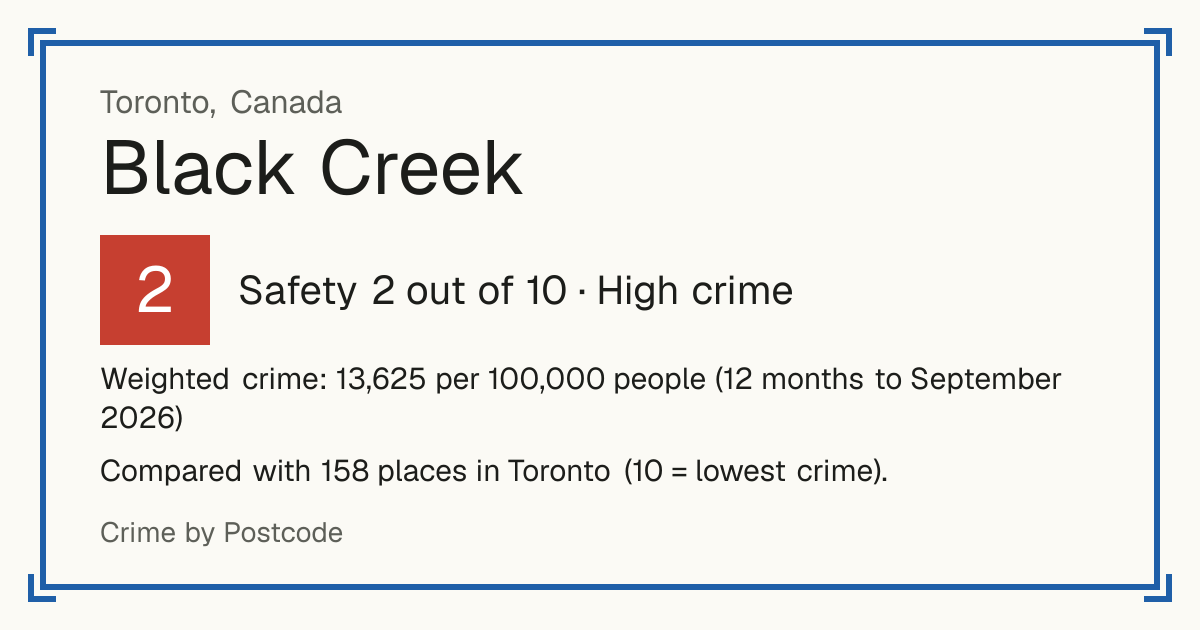
2Black Creek
Black Creek, Canada: crime rate and Safety score
Safety 2 out of 10 High crime
2/10 in Toronto · 5/10 in the world
Compared with 158 places in Toronto (10 = lowest crime).
Weighted crime: 13,625 per 100,000 people (12 months to September 2026)
Residents: 23,252
How accurate: in 2026-09, 84% of the 158 neighbourhoods compared scored within 1 of their 2025-09 score.
Crime by type, as recorded by Toronto Police Service (12 months to September 2026)
| Type | Count | Per 100,000 a year | All places this source covers |
|---|---|---|---|
| Violence | |||
| Assault | 272 | 1,169.8 | 768.1 |
| Robbery | |||
| Robbery | 24 | 103.2 | 75.1 |
| Theft and burglary | |||
| Break and enter | 20 | 86 | 188.4 |
| Motor vehicle theft | 91 | 391.4 | 239.1 |
| Theft over $5,000 | 17 | 73.1 | 62.4 |
| Toronto Police publish only these five categories by neighbourhood, counted per offence or victim. Sexual offences, homicides, drugs and thefts under $5,000 are not included. | |||
Source: Toronto Police Service, updated 28 October 2026.
Recorded crime by type (12 months to September 2026)
| Violence | 272 |
|---|---|
| Robbery | 24 |
| Theft and burglary | 128 |
Questions about crime in Black Creek
- Is Black Creek safe?
- Black Creek: Safety 2 out of 10 (High crime). Compared with 158 places in Toronto (10 = lowest crime).
- What is the crime rate in Black Creek?
- Black Creek: Weighted crime: 13,625 per 100,000 people (12 months to September 2026).