Saint-Pierre-des-Corps, France: crime rate and Safety score
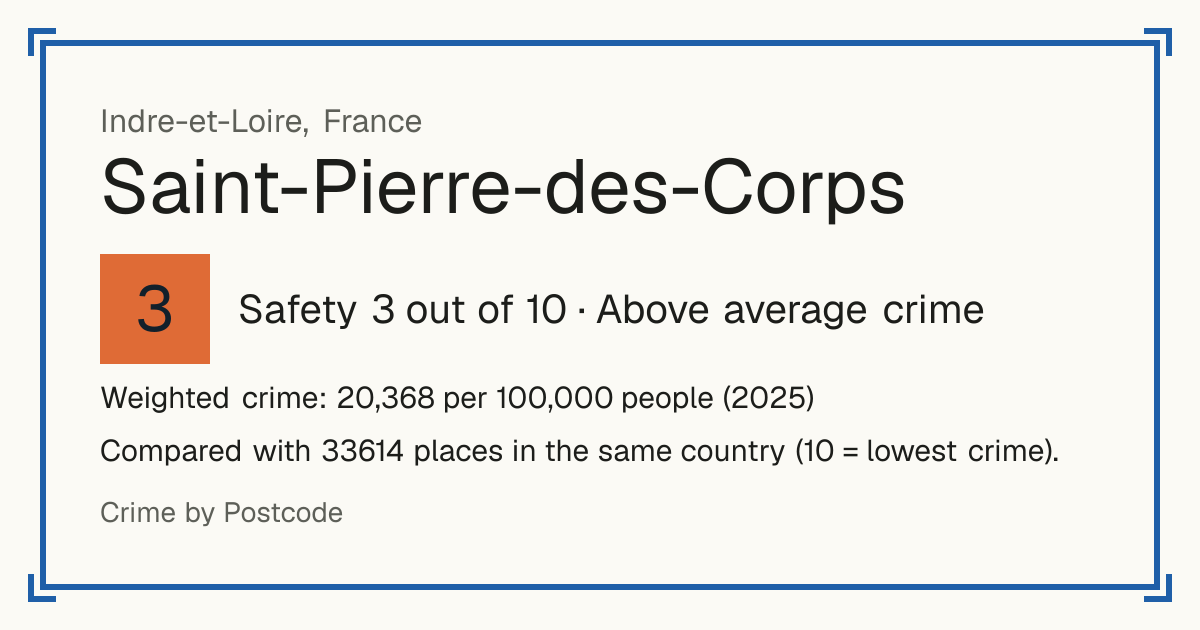
Safety 3 out of 10 Above average crime
3/10 in France · 7/10 in the world
Compared with 33614 places in the same country (10 = lowest crime). 1255 places were left out of the comparison (incomplete figures or very few residents).
Weighted crime: 20,368 per 100,000 people (2025)
Crime by type, as recorded by SSMSI (Ministère de l'Intérieur) (2025)
| Type | Count | Per 100,000 a year | All places this source covers |
|---|---|---|---|
| Sexual offences | |||
| Sexual violence | 24 | 151 | 193.3 |
| Counts victims, not offences. | |||
| Violence | |||
| Domestic physical violence | 65 | 408.9 | 375.5 |
| Counts victims, not offences. | |||
| Physical violence outside the family | 61 | 383.7 | 315.6 |
| Counts victims, not offences. | |||
| Robbery | |||
| Armed robbery | not published | - | 11.6 |
| Violent theft without a weapon | 14 | 88.1 | 72 |
| Theft and burglary | |||
| Theft from people without violence | 237 | 1,490.8 | 910.1 |
| Counts victims who reported it, not offences. | |||
| Home burglary | 59 | 371.1 | 309.6 |
| Vehicle theft | 44 | 276.8 | 182.6 |
| Counts vehicles, not offences. | |||
| Theft from vehicles | 142 | 893.2 | 341.5 |
| Counts vehicles, not offences. | |||
| Theft of vehicle parts | 29 | 182.4 | 139.4 |
| Counts vehicles, not offences. | |||
| Drugs | |||
| Drug use | 51 | 320.8 | 453.9 |
| Counts people implicated, not offences; on-the-spot drug fines are not included. | |||
| Drug trafficking | not published | - | 84.8 |
| Counts people implicated, not offences. | |||
| Damage and public order | |||
| Deliberate damage | 167 | 1,050.4 | 788.7 |
| Other | |||
| Fraud and payment card fraud | 87 | 547.2 | 651.7 |
| Counts victims, in the commune where the victim lives, not where the fraud happened. | |||
Source: SSMSI (Ministère de l'Intérieur), updated 28 October 2026.
Recorded crime by type (2025)
| Sexual offences | 24 |
|---|---|
| Violence | 126 |
| Robbery | not published |
| Theft and burglary | 511 |
| Drugs | not published |
| Damage and public order | 167 |
| Other | 87 |
Questions about crime in Saint-Pierre-des-Corps
- Is Saint-Pierre-des-Corps safe?
- Saint-Pierre-des-Corps: Safety 3 out of 10 (Above average crime). Compared with 33614 places in the same country (10 = lowest crime). 1255 places were left out of the comparison (incomplete figures or very few residents).
- What is the crime rate in Saint-Pierre-des-Corps?
- Saint-Pierre-des-Corps: Weighted crime: 20,368 per 100,000 people (2025).
Living
10/10 Living 10 out of 10, compared with other places in the same country.
Raw score 8.6 out of 10, before ranking.
- Schools: 10/10
- Transport: 6/10
- Health: 9/10
- Supermarkets: 9/10
Nearest places
- School: École primaire Viala-Stalingrad 280 m
- School: École maternelle Stalingrad 300 m
- School: Collège Stalingrad 380 m
- School 390 m
- School: École primaire Sablons-Semard 710 m
- Railway station: Saint-Pierre-des-Corps 750 m
- Doctor or clinic: Centre de radiologie GRIM 770 m
- A&E: Hôpital Clocheville 4.0 km
- Supermarket: Chronodrive 850 m
- Supermarket: Lidl 1.1 km
Schools count by distance only: there are no inspection grades to use.
Other places nearby
- Tours 2/10
- La Ville-aux-Dames 5/10
- Saint-Avertin 6/10
- Chambray-lès-Tours 2/10
- Saint-Cyr-sur-Loire 6/10
- La Riche 3/10
- Joué-lès-Tours 4/10
- Montlouis-sur-Loire 4/10
Mayors of Saint-Pierre-des-Corps since 2014
Saint-Pierre-des-Corps: Other right. Département president: Nadège Arnault (The Republicans)
Olivier CONTE · Other right
since March 2026
Too early to compare
Emmanuel FRANÇOIS · Other right
July 2020 – March 2026
excludes types not published for this commune
Saint-Pierre-des-Corps ▼ −14% · France ▲ +22%
Recorded crime per 1,000 people, the year before taking office vs the latest year in office
Marie-France BEAUFILS · Communist
March 2014 – July 2020
figures start in 2016
excludes types not published for this commune
Saint-Pierre-des-Corps ▲ +23% · France ▼ −13%
Recorded crime per 1,000 people, the year before taking office vs the latest year in office
Maires: Répertoire national des élus and Ministère de l'Intérieur election results. Crime: SSMSI. Licence Ouverte v2.0. Maires 2014: Ministère de l'Intérieur via IdeesLibres (ODbL).