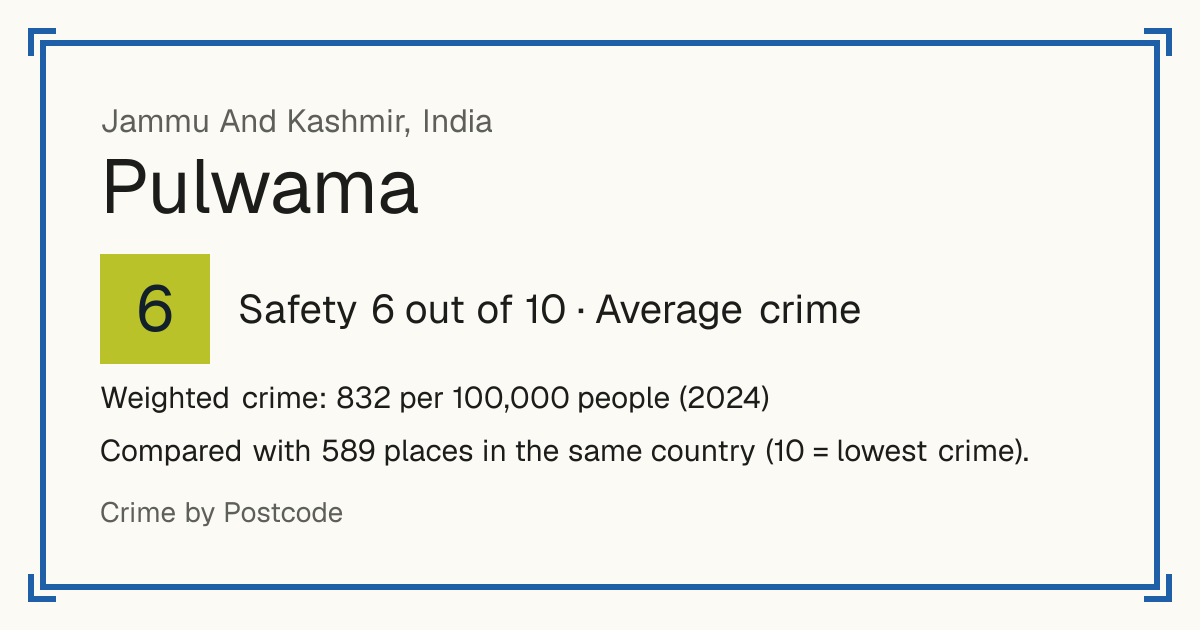
6Pulwama
Pulwama, India: crime rate and Safety score
Safety 6 out of 10 Average crime
6/10 in India · 6/10 in the world
Compared with 589 places in the same country (10 = lowest crime).
Weighted crime: 832 per 100,000 people (2024)
Crime by type, as recorded by National Crime Records Bureau (2024)
| Type | Count | Per 100,000 a year | All places this source covers |
|---|---|---|---|
| Homicide | |||
| Murder | 1 | 0.2 | 2.2 |
| Culpable homicide | 1 | 0.2 | 0.3 |
| Killings that the law does not class as murder. | |||
| Sexual offences | |||
| Rape | 7 | 1.3 | 2.1 |
| Attempted rape | 0 | 0 | 0.2 |
| Attempts only. | |||
| Sexual assault and harassment of women | 103 | 18.6 | 5.6 |
| Includes sexual harassment, stalking and voyeurism. | |||
| Violence | |||
| Attempted murder | 8 | 1.4 | 6.2 |
| Attempts only. | |||
| Hurt and grievous hurt | 127 | 22.9 | 37.8 |
| Includes acid attacks. | |||
| Kidnapping and abduction | 36 | 6.5 | 10.1 |
| Includes missing children the police record as kidnapped. | |||
| Dowry deaths | 0 | 0 | 0.5 |
| Cruelty by husband or relatives | 10 | 1.8 | 8.4 |
| Robbery | |||
| Robbery | 3 | 0.5 | 1.7 |
| Includes attempted robbery and dacoity. | |||
| Dacoity (gang robbery) | 0 | 0 | 0.5 |
| Robbery by five or more people, including preparing or assembling for it. | |||
| Extortion | 0 | 0 | 0.9 |
| Theft and burglary | |||
| Burglary | 53 | 9.5 | 7.5 |
| Vehicle theft | 13 | 2.3 | 15.1 |
| Other theft | 103 | 18.6 | 15.1 |
| Includes snatching. | |||
| Damage and public order | |||
| Rioting | 14 | 2.5 | 2.7 |
| Unlawful assembly, affray and promoting enmity | 0 | 0 | 1 |
| Criminal damage and arson | 4 | 0.7 | 0.9 |
| Other | |||
| Fraud and forgery | 24 | 4.3 | 10.8 |
| Breach of trust and misappropriation | 3 | 0.5 | 1.7 |
Source: National Crime Records Bureau, updated 29 October 2026.
Recorded crime by type (2024)
| Homicide | 2 |
|---|---|
| Sexual offences | 110 |
| Violence | 181 |
| Robbery | 3 |
| Theft and burglary | 169 |
| Damage and public order | 18 |
| Other | 27 |
Questions about crime in Pulwama
- Is Pulwama safe?
- Pulwama: Safety 6 out of 10 (Average crime). Compared with 589 places in the same country (10 = lowest crime).
- What is the crime rate in Pulwama?
- Pulwama: Weighted crime: 832 per 100,000 people (2024).
- How many murders are there in Pulwama?
- Recorded homicides in Pulwama (2024): 2.