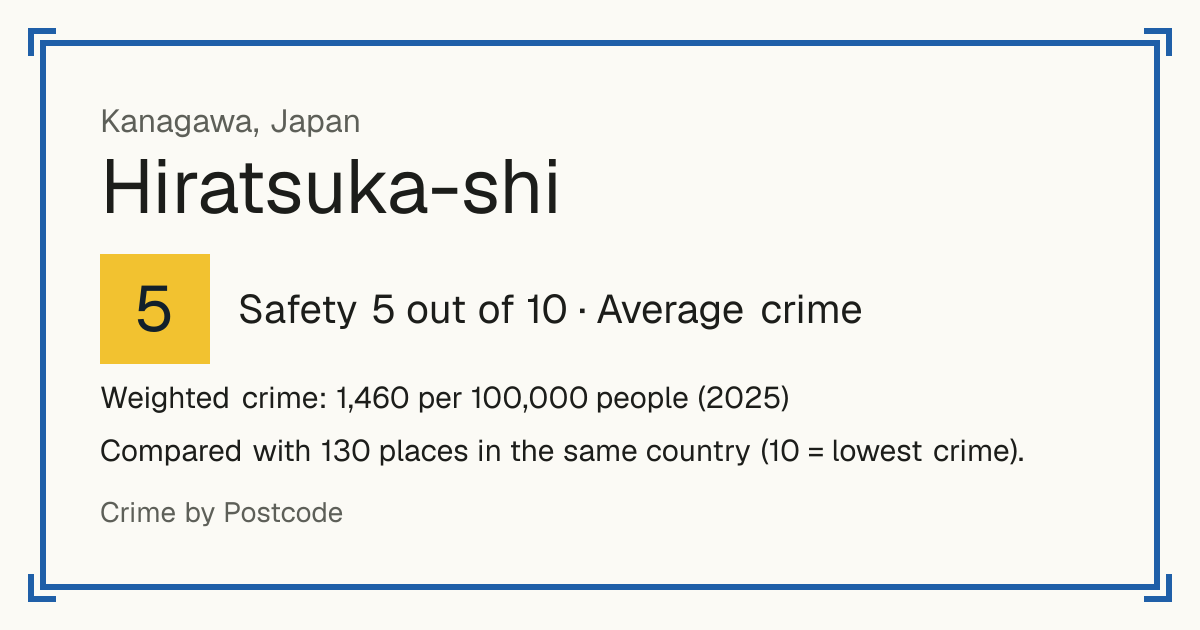
5Hiratsuka-shi
Hiratsuka-shi, Japan: crime rate and Safety score
Safety 5 out of 10 Average crime
5/10 in Japan · 10/10 in the world
Compared with 130 places in the same country (10 = lowest crime).
Weighted crime: 1,460 per 100,000 people (2025)
Crime by type, as recorded by Prefectural police (2025)
| Type | Count | Per 100,000 a year | All places this source covers |
|---|---|---|---|
| Violence | |||
| Murder and rape | 4 | 1.5 | 4.5 |
| Kanagawa and Osaka publish these serious crimes together by municipality, so they cannot be shown apart. | |||
| Assault without injury | 32 | 12.4 | 19.6 |
| Assault causing injury | 28 | 10.8 | 24 |
| Extortion | 3 | 1.2 | 1.6 |
| Other violent crime | 4 | 1.5 | 1.1 |
| Includes threats where they are not shown on their own line, and gathering with weapons. | |||
| Robbery | |||
| Robbery | 1 | 0.4 | 1.7 |
| Theft and burglary | |||
| Burglary | 87 | 33.7 | 23.8 |
| Homes, shops, offices and other buildings. | |||
| Car theft | 4 | 1.5 | 6.5 |
| Motorbike theft | 142 | 54.9 | 25.6 |
| Bicycle theft | 581 | 224.8 | 203.4 |
| Theft from cars | 42 | 16.3 | 24 |
| Theft of car parts | 53 | 20.5 | 20.2 |
| Shoplifting | 229 | 88.6 | 85 |
| Bag snatching | 1 | 0.4 | 0.7 |
| Pickpocketing | 3 | 1.2 | 2 |
| Other theft | 279 | 108 | 127.2 |
| The thefts not listed above. | |||
| Damage and public order | |||
| Arson | 0 | 0 | 0.9 |
| Criminal damage | 56 | 21.7 | 43.3 |
| Other | |||
| Fraud | 77 | 29.8 | 66.6 |
| Embezzlement, forgery and bribery | 3 | 1.2 | 3.6 |
| Trespass | 27 | 10.4 | 8.8 |
| Other offences | 50 | 19.3 | 23.7 |
| Includes keeping lost property, obstructing officials, kidnapping and handling stolen goods. | |||
Source: Prefectural police, updated 28 October 2026.
Recorded crime by type (2025)
| Violence | 71 |
|---|---|
| Robbery | 1 |
| Theft and burglary | 1,421 |
| Damage and public order | 56 |
| Other | 157 |
Questions about crime in Hiratsuka-shi
- Is Hiratsuka-shi safe?
- Hiratsuka-shi: Safety 5 out of 10 (Average crime). Compared with 130 places in the same country (10 = lowest crime).
- What is the crime rate in Hiratsuka-shi?
- Hiratsuka-shi: Weighted crime: 1,460 per 100,000 people (2025).