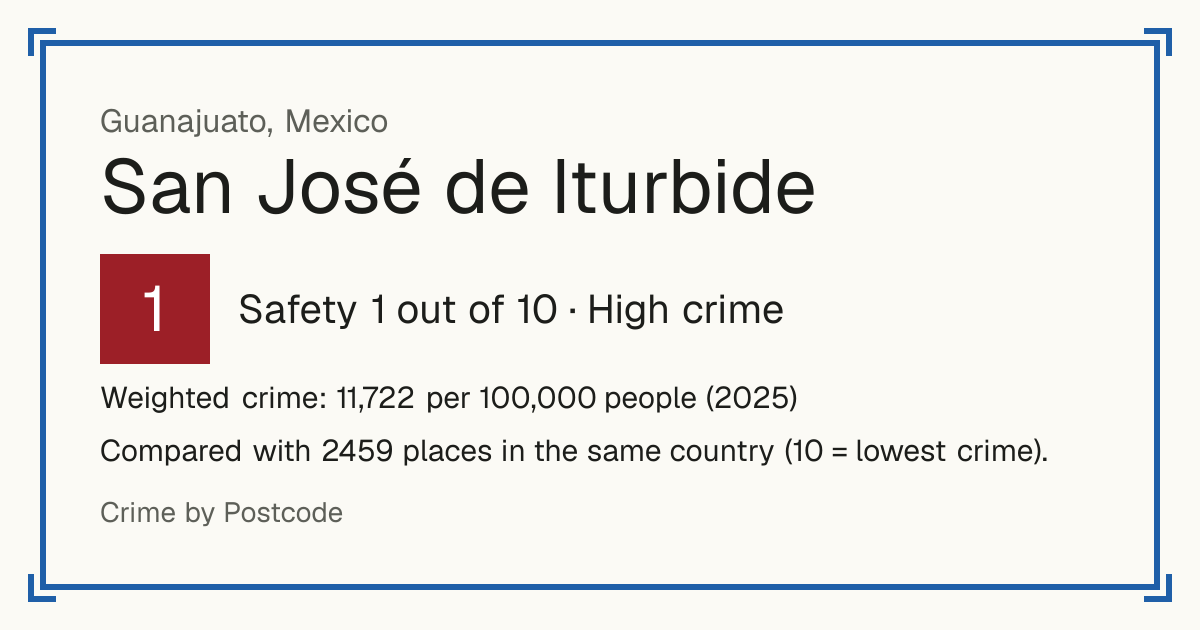
1San José de Iturbide
San José de Iturbide, Mexico: crime rate and Safety score
Safety 1 out of 10 High crime
1/10 in Mexico · 1/10 in the world
Compared with 2459 places in the same country (10 = lowest crime). 10 places were left out of the comparison (incomplete figures or very few residents).
Weighted crime: 11,722 per 100,000 people (2025)
Crime by type, as recorded by SESNSP (2025)
| Type | Count | Per 100,000 a year | All places this source covers |
|---|---|---|---|
| Homicide | |||
| Intentional homicide | 15 | 16.7 | 15.8 |
| SESNSP counts investigation files opened by the state prosecutors (carpetas de investigación), not victims. | |||
| Femicide | 0 | 0 | 0.6 |
| Sexual offences | |||
| Rape | 22 | 24.6 | 15.9 |
| Sexual abuse | 26 | 29 | 25.9 |
| Sexual harassment and other sexual offences | 11 | 12.3 | 21.8 |
| Violence | |||
| Intentional assault | 235 | 262.4 | 123.5 |
| Domestic violence | 223 | 249 | 210.6 |
| Kidnapping | 0 | 0 | 0.4 |
| Robbery | |||
| Street robbery | 7 | 7.8 | 29.6 |
| Robbery on transport and of hauliers | 0 | 0 | 11.9 |
| Robbery in homes | 2 | 2.2 | 3.1 |
| Vehicle robbery (carjacking) | 69 | 77 | 30.5 |
| Robbery of businesses | 22 | 24.6 | 21.4 |
| Other robbery | 70 | 78.2 | 21.1 |
| Robbery of car parts, banks, livestock, machinery and other robbery with violence. | |||
| Extortion | 22 | 24.6 | 8.3 |
| Theft and burglary | |||
| Burglary | 66 | 73.7 | 25.8 |
| Vehicle theft | 123 | 137.3 | 59.9 |
| Theft of car parts | 0 | 0 | 14.8 |
| Theft from the person and on transport | 1 | 1.1 | 22.5 |
| Theft from businesses | 47 | 52.5 | 30.9 |
| Other theft | 291 | 324.9 | 103.7 |
| Theft from hauliers and banks, of livestock, machinery and other theft without violence. | |||
| Drugs | |||
| Drug dealing (small scale) | 81 | 90.4 | 82.3 |
| State-level drug offences (narcomenudeo); federal drug crimes are not in this file. | |||
| Damage and public order | |||
| Criminal damage | 224 | 250.1 | 106.3 |
| Threats | 155 | 173.1 | 110 |
| Home trespass | 12 | 13.4 | 10.6 |
| Other | |||
| Fraud | 93 | 103.8 | 84.1 |
Source: SESNSP, updated 29 October 2026.
Recorded crime by type (2025)
| Homicide | 15 |
|---|---|
| Sexual offences | 59 |
| Violence | 458 |
| Robbery | 192 |
| Theft and burglary | 528 |
| Drugs | 81 |
| Damage and public order | 391 |
| Other | 93 |
Questions about crime in San José de Iturbide
- Is San José de Iturbide safe?
- San José de Iturbide: Safety 1 out of 10 (High crime). Compared with 2459 places in the same country (10 = lowest crime). 10 places were left out of the comparison (incomplete figures or very few residents).
- What is the crime rate in San José de Iturbide?
- San José de Iturbide: Weighted crime: 11,722 per 100,000 people (2025).
- How many murders are there in San José de Iturbide?
- Recorded homicides in San José de Iturbide (2025): 15.