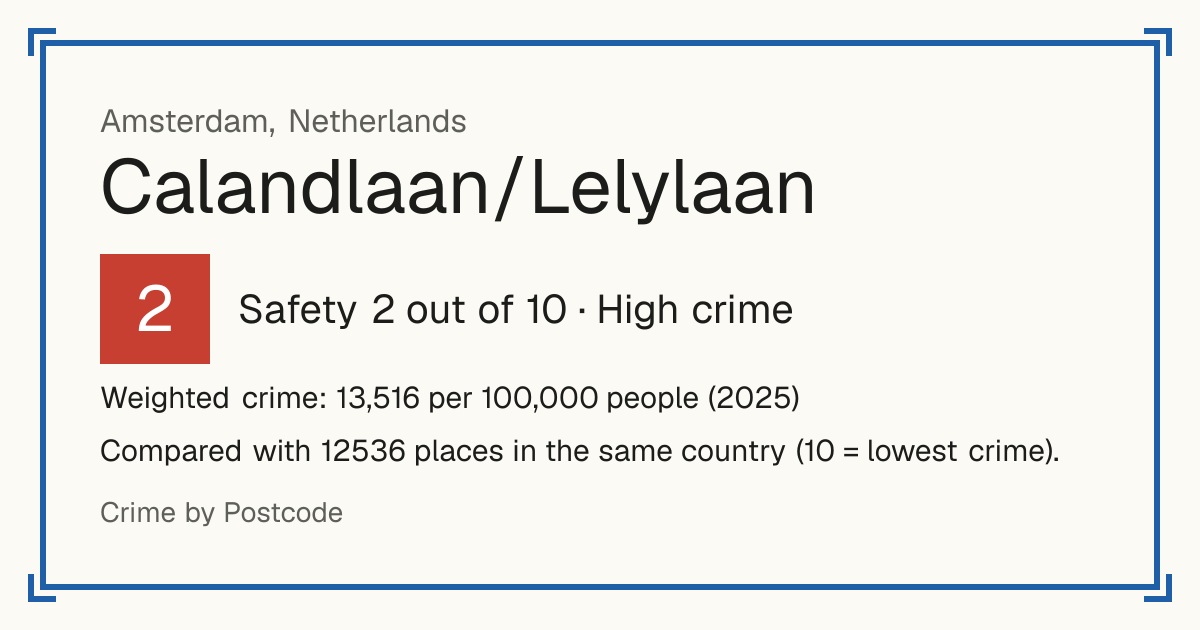
2Calandlaan/Lelylaan
Calandlaan/Lelylaan, Netherlands: crime rate and Safety score
Safety 2 out of 10 High crime
2/10 in Netherlands · 7/10 in the world
Compared with 12536 places in the same country (10 = lowest crime). 1694 places were left out of the comparison (incomplete figures or very few residents).
Weighted crime: 13,516 per 100,000 people (2025)
Residents: 1,280
How accurate: in 2025, 57% of the 12,071 neighbourhoods compared scored within 1 of their 2024 score.
Crime by type, as recorded by CBS / Politie (2025)
| Type | Count | Per 100,000 a year | All places this source covers |
|---|---|---|---|
| Homicide | |||
| Murder and manslaughter | 0 | 0 | 14.3 |
| Police registrations: attempts are included. | |||
| Violence | |||
| Public violence against people | 2 | 156.3 | 24.2 |
| Threats | 3 | 234.4 | 142.5 |
| Assault | 6 | 468.8 | 228.5 |
| Robbery | |||
| Street robbery | 0 | 0 | 15.2 |
| Hold-up of a home or business | 0 | 0 | 2.9 |
| Theft and burglary | |||
| Home burglary | 2 | 156.3 | 119.8 |
| Burglary of sheds and garages | 1 | 78.1 | 59.2 |
| Theft from motor vehicles | 4 | 312.5 | 231.3 |
| Theft of motor vehicles | 2 | 156.3 | 47.3 |
| Bicycle and moped theft | 6 | 468.8 | 539.1 |
| Pickpocketing | 1 | 78.1 | 38.1 |
| Theft of or from other vehicles | 6 | 468.8 | 195.5 |
| Theft on water (boats and moorings) | 0 | 0 | 4.3 |
| Burglary and theft at businesses | 1 | 78.1 | 63.8 |
| Shoplifting | 0 | 0 | 202.4 |
| Drugs | |||
| Drug and drink nuisance | 0 | 0 | 0.9 |
| Nuisance reports, not drug crimes as such. | |||
| Drug dealing | 2 | 156.3 | 82.4 |
| Damage and public order | |||
| Vandalism and damage | 11 | 859.4 | 392.1 |
| Disturbing public order | 2 | 156.3 | 54.5 |
Source: CBS / Politie, updated 28 October 2026.
Recorded crime by type (2025)
| Homicide | 0 |
|---|---|
| Violence | 11 |
| Robbery | 0 |
| Theft and burglary | 23 |
| Drugs | 2 |
| Damage and public order | 13 |
Questions about crime in Calandlaan/Lelylaan
- Is Calandlaan/Lelylaan safe?
- Calandlaan/Lelylaan: Safety 2 out of 10 (High crime). Compared with 12536 places in the same country (10 = lowest crime). 1694 places were left out of the comparison (incomplete figures or very few residents).
- What is the crime rate in Calandlaan/Lelylaan?
- Calandlaan/Lelylaan: Weighted crime: 13,516 per 100,000 people (2025).
- How many murders are there in Calandlaan/Lelylaan?
- Recorded homicides in Calandlaan/Lelylaan (2025): 0.
Living
10/10 Living 10 out of 10, compared with other places in the same country.
Raw score 9.8 out of 10, before ranking.
- Schools: 10/10
- Transport: 10/10
- Health: 9/10
- Supermarkets: 10/10
Nearest places
- School: Calandlyceum 270 m
- School: Ichthusschool 330 m
- School: Osdorpse Montessori School 510 m
- School: De Wereldburger 730 m
- School: Louis Bouwmeesterschool 830 m
- Bus stop: Louis Davidsstraat 210 m
- Bus stop: C.K. Eloutstraat 220 m
- Bus stop: C.K. Eloutstraat 220 m
- Railway station: Amsterdam Lelylaan 1.7 km
- Tram or metro stop: Meer en Vaart 90 m
- Doctor or clinic: Oosteinde Walborg Kliniek 180 m
- A&E: OLVG, locatie Oost 7.3 km
- Supermarket: Jumbo 380 m
- Supermarket: Lidl 460 m
Schools count by distance only: there are no inspection grades to use.