2San Juan del Oro
San Juan del Oro, Peru: crime rate and Safety score
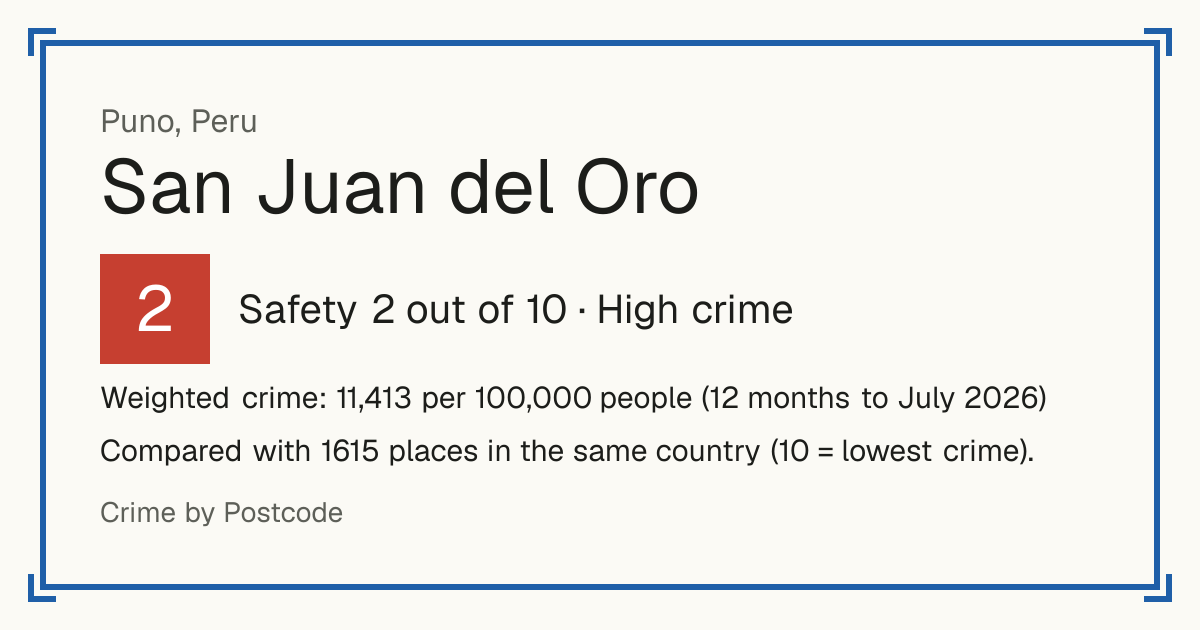
Safety 2 out of 10 High crime
2/10 in Peru · 2/10 in the world
Compared with 1615 places in the same country (10 = lowest crime). 3 places were left out of the comparison (incomplete figures or very few residents).
Weighted crime: 11,413 per 100,000 people (12 months to July 2026)
Crime by type, as recorded by Ministerio del Interior (Perú) (12 months to July 2026)
| Type | Count | Per 100,000 a year | All places this source covers |
|---|---|---|---|
| Violence | |||
| Violence against women and family members | 22 | 1,012.4 | 633.6 |
| Kidnapping | 0 | 0 | 3.3 |
| Robbery | |||
| Robbery | 2 | 92 | 155.8 |
| Robo: theft with violence or threats. | |||
| Extortion | 0 | 0 | 67.3 |
| Theft and burglary | |||
| Theft | 6 | 276.1 | 519.9 |
| Hurto: theft without violence or threats. | |||
| Other | |||
| Fraud | 0 | 0 | 114.1 |
Source: Ministerio del Interior (Perú), updated 26 October 2026.
Recorded crime by type (12 months to July 2026)
| Violence | 22 |
|---|---|
| Robbery | 2 |
| Theft and burglary | 6 |
| Other | 0 |
Questions about crime in San Juan del Oro
- Is San Juan del Oro safe?
- San Juan del Oro: Safety 2 out of 10 (High crime). Compared with 1615 places in the same country (10 = lowest crime). 3 places were left out of the comparison (incomplete figures or very few residents).
- What is the crime rate in San Juan del Oro?
- San Juan del Oro: Weighted crime: 11,413 per 100,000 people (12 months to July 2026).
Other places nearby
- Alto Inambari 10/10
- Sandia 5/10
- Phara 8/10
- Cuyocuyo 9/10
- San Pedro de Putina Punco 10/10
- Ananea 4/10
- Crucero 6/10
- Quilcapuncu 10/10