SGSingapore
Singapore: crime, homicide rate and trend
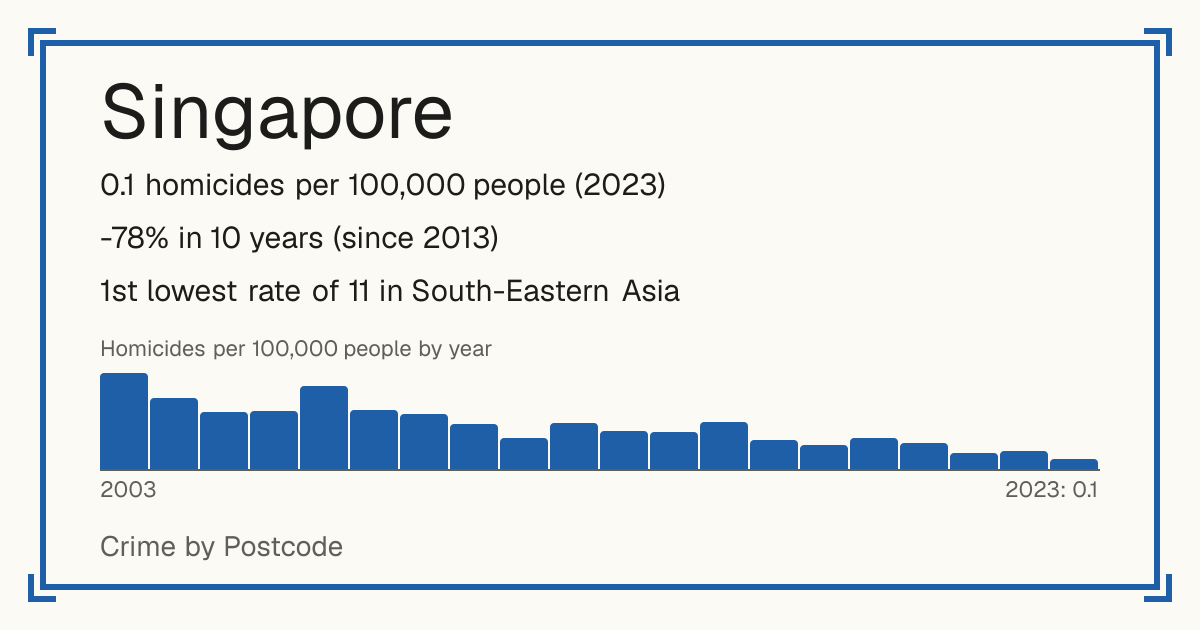
- 0.1 homicides per 100,000 people (2023)
- -78% in 10 years (since 2013)
- 1st lowest rate of 11 in South-Eastern Asia
- World median: 3.8 per 100,000
- Source: World Bank, from UNODC, 2023.
Safety 10 out of 10 compared with the world
Questions about crime in Singapore
- Is Singapore safe?
- Singapore: 0.1 homicides per 100,000 people (2023). 1st lowest rate of 11 in South-Eastern Asia. World median: 3.8 per 100,000. Safety 10 out of 10 compared with the world.
- What is the murder rate in Singapore?
- Singapore: 0.1 homicides per 100,000 people (2023). Source: World Bank, from UNODC, 2023.
- Is crime going up in Singapore?
- The homicide rate is down 78% since 2013: from 0.3 per 100,000 people in 2013 to 0.1 in 2023.
- Which places in Singapore have the least crime?
- Lowest crime among the 31 municipalities compared: Pasir Ris (10/10), Choa Chu Kang (10/10), Woodlands East (10/10). The lists on this page rank them all.
- Which places in Singapore have the most crime?
- Highest crime among the 31 municipalities compared: Marina Bay (1/10), Orchard (1/10), Rochor (1/10). The lists on this page rank them all.
Lowest crime places in Singapore
- Pasir Ris 10/10
- Choa Chu Kang 10/10
- Woodlands East 10/10
- Sembawang 10/10
- Tampines 9/10
- Bukit Batok and Bukit Panjang 9/10
- Bedok 9/10
- Clementi 8/10
- Marine Parade 8/10
- Jurong West 8/10
Ranked by crime per 100,000 people among the 31 municipalities compared, with each place's Safety score (1 to 10, 10 = lowest crime).
Highest crime places in Singapore
- Marina Bay 1/10
- Orchard 1/10
- Rochor 1/10
- Bukit Merah East 2/10
- Jurong East 2/10
- Bukit Merah West 2/10
- Woodlands West 3/10
- Geylang 3/10
- Toa Payoh 3/10
- Ang Mo Kio North 4/10
Ranked by crime per 100,000 people among the 31 municipalities compared, with each place's Safety score (1 to 10, 10 = lowest crime).
Places in Singapore
- Ang Mo Kio North 4/10
- Ang Mo Kio South 4/10
- Bedok 9/10
- Bishan 5/10
- Bukit Batok and Bukit Panjang 9/10
- Bukit Merah East 2/10
- Bukit Merah West 2/10
- Changi 7/10
- Choa Chu Kang 10/10
- Clementi 8/10
- Geylang 3/10
- Jurong East 2/10
- Jurong West 8/10
- Kampong Java and Bukit Timah 5/10
- Marina Bay 1/10
- Marine Parade 8/10
- Nanyang 4/10
- Orchard 1/10
- Pasir Ris 10/10
- Punggol 7/10
- Queenstown 6/10
- Rochor 1/10
- Sembawang 10/10
- Sengkang 7/10
- Serangoon and Hougang 5/10
- Tampines 9/10
- Toa Payoh 3/10
- Woodlands East 10/10
- Woodlands West 3/10
- Woodleigh 6/10
- Yishun 6/10
Homicides per 100,000 people by year
| Year | Per 100,000 |
|---|---|
| 2023 | 0.1 |
| 2022 | 0.1 |
| 2021 | 0.1 |
| 2020 | 0.2 |
| 2019 | 0.2 |
| 2018 | 0.2 |
| 2017 | 0.2 |
| 2016 | 0.3 |
| 2015 | 0.3 |
| 2014 | 0.3 |
| 2013 | 0.3 |
| 2012 | 0.2 |
| 2011 | 0.3 |
| 2010 | 0.4 |
| 2009 | 0.4 |
| 2008 | 0.6 |
| 2007 | 0.4 |
| 2006 | 0.4 |
| 2004 | 0.5 |
| 2003 | 0.7 |
| 2002 | 0.7 |
| 2001 | 0.8 |
| 2000 | 1 |