6Murska Sobota
Murska Sobota, Slovenia: crime rate and Safety score
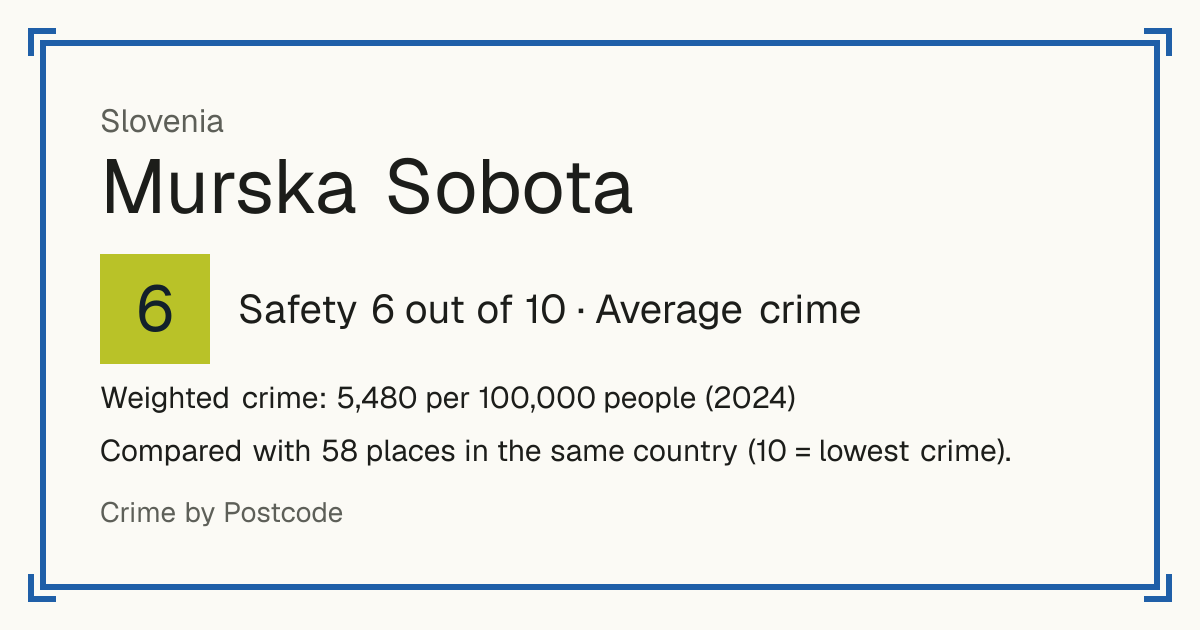
Safety 6 out of 10 Average crime
6/10 in Slovenia · 10/10 in the world
Compared with 58 places in the same country (10 = lowest crime).
Weighted crime: 5,480 per 100,000 people (2024)
Crime by type, as recorded by Policija (2024)
| Type | Count | Per 100,000 a year | All places this source covers |
|---|---|---|---|
| Homicide | |||
| Murder and manslaughter | 0 | 0 | 2 |
| Includes attempts. | |||
| Sexual offences | |||
| Sexual offences | 10 | 18.5 | 39.4 |
| Violence | |||
| Bodily harm | 54 | 99.9 | 85.7 |
| Domestic violence | 61 | 112.8 | 80.8 |
| Threats | 68 | 125.8 | 99.8 |
| Violent behaviour | 10 | 18.5 | 28.1 |
| Robbery | |||
| Robbery | 4 | 7.4 | 14.2 |
| Theft and burglary | |||
| Aggravated theft, mostly burglary | 53 | 98 | 369.2 |
| Theft | 246 | 455.1 | 869.9 |
| Drugs | |||
| Drug production and dealing | 19 | 35.1 | 50 |
| Damage and public order | |||
| Criminal damage | 58 | 107.3 | 180.1 |
| Other | |||
| Fraud | 106 | 196.1 | 265.7 |
Source: Policija, updated 21 October 2026.
Recorded crime by type (2024)
| Homicide | 0 |
|---|---|
| Sexual offences | 10 |
| Violence | 193 |
| Robbery | 4 |
| Theft and burglary | 299 |
| Drugs | 19 |
| Damage and public order | 58 |
| Other | 106 |
Questions about crime in Murska Sobota
- Is Murska Sobota safe?
- Murska Sobota: Safety 6 out of 10 (Average crime). Compared with 58 places in the same country (10 = lowest crime).
- What is the crime rate in Murska Sobota?
- Murska Sobota: Weighted crime: 5,480 per 100,000 people (2024).
- How many murders are there in Murska Sobota?
- Recorded homicides in Murska Sobota (2024): 0.
Living
4/10 Living 4 out of 10, compared with other places in the same country.
Raw score 2.9 out of 10, before ranking.
- Schools: 1/10
- Transport: 3/10
- Health: 4/10
- Supermarkets: 5/10
Nearest places
- Bus stop: Košarovci 200 m
- Railway station: Mačkovci 3.3 km
- Doctor or clinic: Splošna ambulanta Gornji Petrovci 5.3 km
- A&E: Splošna bolnišnica Murska Sobota 12.5 km
- Supermarket: Spar Partner Goričanka 3.4 km
- Supermarket: Mercator 8.7 km
Schools count by distance only: there are no inspection grades to use.