CHSwitzerland
Switzerland: crime, homicide rate and trend
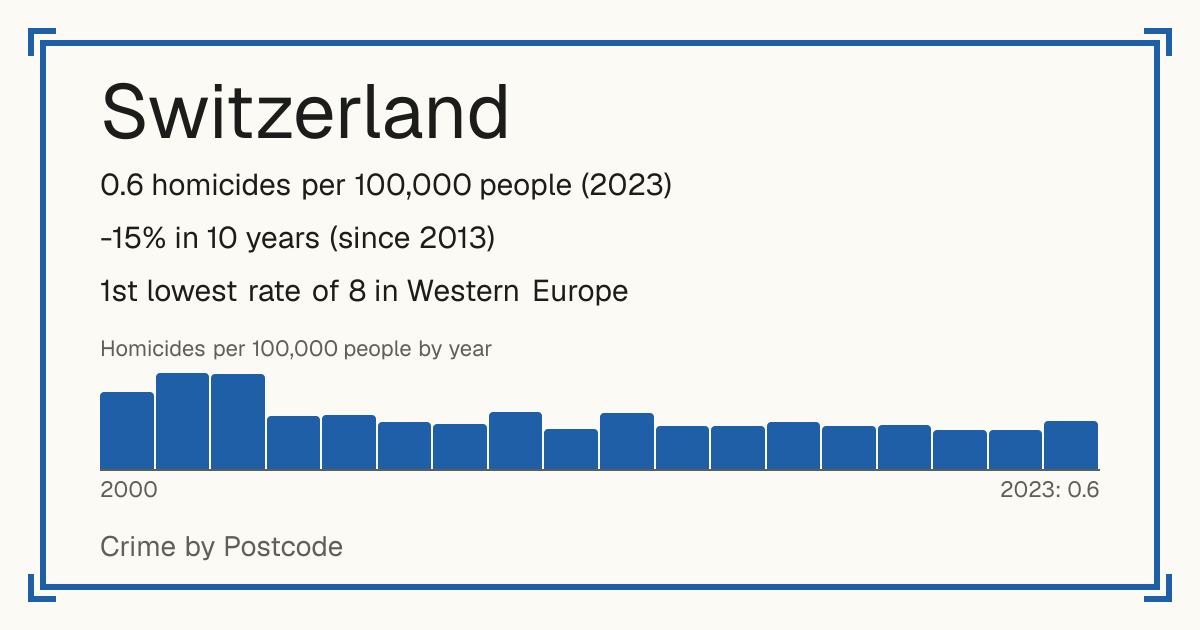
- 0.6 homicides per 100,000 people (2023)
- -15% in 10 years (since 2013)
- 1st lowest rate of 8 in Western Europe
- World median: 3.8 per 100,000
- Source: World Bank, from UNODC, 2023.
Safety 8 out of 10 compared with the world
Questions about crime in Switzerland
- Is Switzerland safe?
- Switzerland: 0.6 homicides per 100,000 people (2023). 1st lowest rate of 8 in Western Europe. World median: 3.8 per 100,000. Safety 8 out of 10 compared with the world.
- What is the murder rate in Switzerland?
- Switzerland: 0.6 homicides per 100,000 people (2023). Source: World Bank, from UNODC, 2023.
- Is crime going up in Switzerland?
- The homicide rate is down 15% since 2013: from 0.7 per 100,000 people in 2013 to 0.6 in 2023.
- Which places in Kanton Zürich have the least crime?
- Lowest crime among the 34 municipalities compared in Kanton Zürich: Gossau (10/10), Männedorf (10/10), Richterswil (10/10). The lists on this page rank them all.
- Which places in Kanton Zürich have the most crime?
- Highest crime among the 34 municipalities compared in Kanton Zürich: Kloten (1/10), Zürich (1/10), Winterthur (1/10). The lists on this page rank them all.
Lowest crime places in Kanton Zürich
- Gossau 10/10
- Männedorf 10/10
- Richterswil 10/10
- Maur 10/10
- Küsnacht 9/10
- Bassersdorf 9/10
- Pfäffikon 9/10
- Horgen 8/10
- Meilen 8/10
- Thalwil 8/10
Ranked by crime per 100,000 people among the 34 municipalities compared in Kanton Zürich, with each place's Safety score (1 to 10, 10 = lowest crime).
Highest crime places in Kanton Zürich
- Kloten 1/10
- Zürich 1/10
- Winterthur 1/10
- Dietikon 2/10
- Schlieren 2/10
- Affoltern 2/10
- Wallisellen 3/10
- Illnau-Effretikon 3/10
- Embrach 3/10
- Regensdorf 3/10
Ranked by crime per 100,000 people among the 34 municipalities compared in Kanton Zürich, with each place's Safety score (1 to 10, 10 = lowest crime).
Places in Switzerland
Crime recorded by the police (2024)
| Crime | Recorded | Per 100,000 |
|---|---|---|
| Intentional homicide | 45 | 0.5 |
| Attempted intentional homicide | 233 | 2.6 |
| Serious assault | 1,029 | 11.5 |
| Kidnapping | 9 | 0.1 |
| Sexual violence | 4,830 | 53.9 |
| of which: Rape | 1,086 | 12.1 |
| of which: Sexual assault | 743 | 8.3 |
| Sexual exploitation | 2,335 | 26.1 |
| Robbery | 2,113 | 23.6 |
| Burglary | 46,070 | 514 |
| of which: Burglary of homes | 27,576 | 307.7 |
| Theft | 176,206 | 1,966.1 |
| of which: Theft of vehicles or parts | 32,022 | 357.3 |
| Drug offences | 48,208 | 537.9 |
| Fraud | 36,947 | 412.3 |
| Corruption | 39 | 0.4 |
| of which: Bribery | 37 | 0.4 |
| Money laundering | 5,758 | 64.3 |
| Taking part in an organised crime group | 36 | 0.4 |
Each country defines and records crime in its own way, so these figures compare a country with itself over time better than with other countries.
Homicides per 100,000 people by year
| Year | Per 100,000 |
|---|---|
| 2023 | 0.6 |
| 2022 | 0.5 |
| 2021 | 0.5 |
| 2020 | 0.5 |
| 2019 | 0.5 |
| 2018 | 0.6 |
| 2017 | 0.5 |
| 2016 | 0.5 |
| 2015 | 0.7 |
| 2014 | 0.5 |
| 2013 | 0.7 |
| 2012 | 0.6 |
| 2011 | 0.6 |
| 2010 | 0.7 |
| 2009 | 0.7 |
| 2002 | 1.2 |
| 2001 | 1.2 |
| 2000 | 1 |