Apache Junction police area, United States: crime rate and Safety score
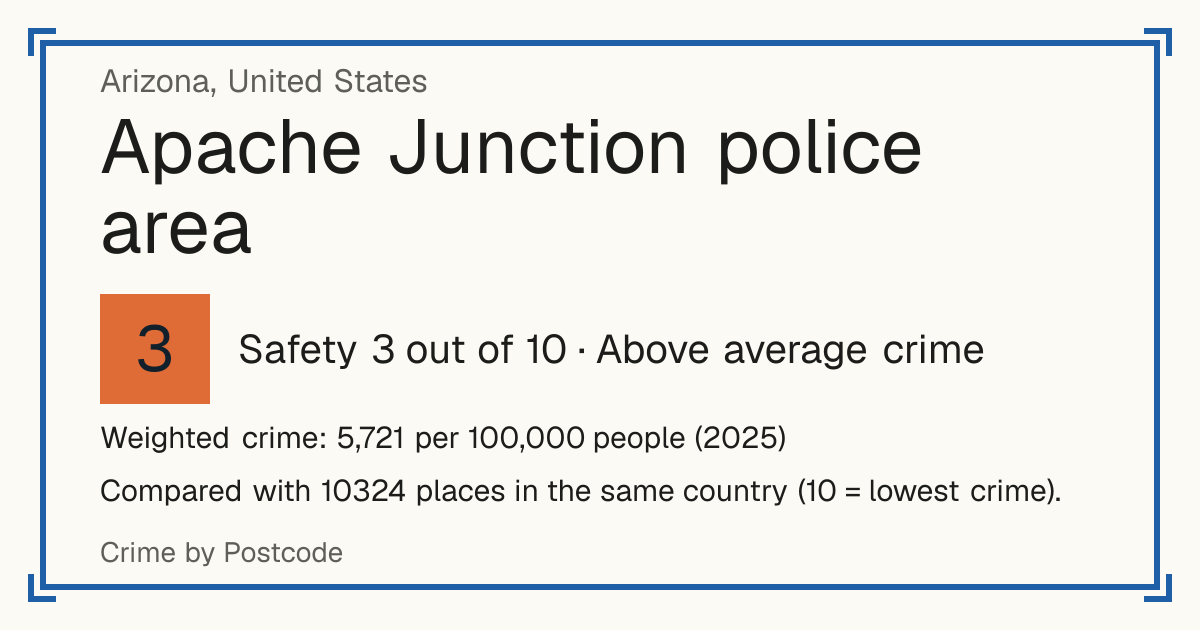
Safety 3 out of 10 Above average crime
3/10 in United States · 3/10 in the world
Compared with 10324 places in the same country (10 = lowest crime). 767 places were left out of the comparison (incomplete figures or very few residents).
Weighted crime: 5,721 per 100,000 people (2025)
Figures are for the police agency that covers Apache Junction police area.
Crime by type, as recorded by FBI Crime Data Explorer (2025)
| Type | Count | Per 100,000 a year | All places this source covers |
|---|---|---|---|
| Homicide | |||
| Murder and non-negligent manslaughter | 0 | 0 | 4.2 |
| Sexual offences | |||
| Rape | 23 | 50.2 | 36 |
| Violence | |||
| Aggravated assault | 112 | 244.4 | 238.3 |
| FBI summary counts: only aggravated assault, not simple assault. | |||
| Robbery | |||
| Robbery | 3 | 6.5 | 50.4 |
| Theft and burglary | |||
| Burglary | 50 | 109.1 | 190.5 |
| Larceny-theft | 395 | 861.8 | 1,141 |
| Motor vehicle theft | 61 | 133.1 | 197.5 |
| Other | |||
| Arson | 6 | 13.1 | 9.1 |
Source: FBI Crime Data Explorer, updated 28 October 2026.
Recorded crime by type (2025)
| Homicide | 0 |
|---|---|
| Sexual offences | 23 |
| Violence | 112 |
| Robbery | 3 |
| Theft and burglary | 506 |
| Other | 6 |
Questions about crime in Apache Junction police area
- Is Apache Junction police area safe?
- Apache Junction police area: Safety 3 out of 10 (Above average crime). Compared with 10324 places in the same country (10 = lowest crime). 767 places were left out of the comparison (incomplete figures or very few residents).
- What is the crime rate in Apache Junction police area?
- Apache Junction police area: Weighted crime: 5,721 per 100,000 people (2025).
- How many murders are there in Apache Junction police area?
- Recorded homicides in Apache Junction police area (2025): 0.
Other places nearby
Sheriffs of Maricopa County since 2010
Apache Junction: Mayor not loaded yet. Maricopa County: Sheriff Jerry Sheridan (Republican). Governor: Katie Hobbs (Democrat)
Jerry Sheridan · Republican
since 2024
Incomplete FBI reporting for this term
Paul Penzone · Democrat
2020 – 2024
Maricopa County ▼ −23% · USA ▼ −6%
Offences reported to the FBI per 1,000 people, the year before the term vs its latest year
Paul Penzone · Democrat
2016 – 2020
Maricopa County ▼ −6% · USA ▼ −15%
Offences reported to the FBI per 1,000 people, the year before the term vs its latest year
Joe Arpaio · Republican
2012 – 2016
Maricopa County ▲ +11% · USA ▼ −10%
Offences reported to the FBI per 1,000 people, the year before the term vs its latest year
Joe Arpaio · Republican
2008 – 2012
In some cities an appointed manager or police chief, not the mayor, runs the police; in some counties the sheriff mainly runs the jail and the courts.
Mayors: Hilbig, Archived Campaign Websites of U.S. Mayoral Candidates (CC BY 4.0) and city sites. Sheriffs: Mavridis, US Sheriff Election Data (CC BY 4.0), MIT Election Data + Science Lab (CC0) and county election offices. Crime: FBI Crime Data Explorer.