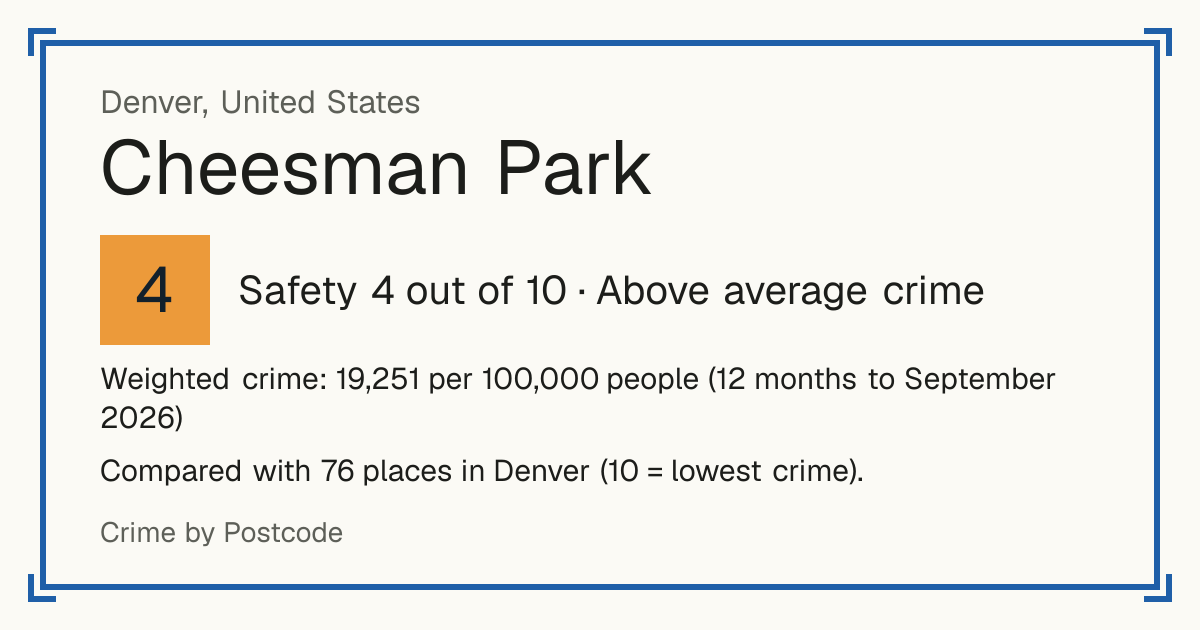
4Cheesman Park
Cheesman Park, United States: crime rate and Safety score
Safety 4 out of 10 Above average crime
4/10 in Denver · 2/10 in the world
Compared with 76 places in Denver (10 = lowest crime). 2 places were left out of the comparison (incomplete figures or very few residents).
Weighted crime: 19,251 per 100,000 people (12 months to September 2026)
Residents: 8,784
How accurate: in 2026-09, 96% of the 76 neighbourhoods compared scored within 1 of their 2025-09 score.
Crime by type, as recorded by Denver Police Department (12 months to September 2026)
| Type | Count | Per 100,000 a year | All places this source covers |
|---|---|---|---|
| Homicide | |||
| Murder | 0 | 0 | 5.5 |
| Violence | |||
| Aggravated assault | 20 | 227.7 | 331.6 |
| Other crimes against people | 43 | 489.5 | 517 |
| Mostly simple assault and intimidation. | |||
| Robbery | |||
| Robbery | 13 | 148 | 125.3 |
| Theft and burglary | |||
| Burglary | 73 | 831.1 | 564.9 |
| Theft | 118 | 1,343.4 | 1,758.2 |
| Theft from vehicles | 126 | 1,434.4 | 1,090.3 |
| Motor vehicle theft | 46 | 523.7 | 634.3 |
| Drugs | |||
| Drug and alcohol offences | 52 | 592 | 569.4 |
| Includes liquor law offences. | |||
| Damage and public order | |||
| Public disorder | 127 | 1,445.8 | 1,404.6 |
| Mostly criminal mischief (vandalism), threats and disturbing the peace. | |||
| Other | |||
| Arson | 0 | 0 | 19 |
Source: Denver Police Department, updated 28 October 2026.
Recorded crime by type (12 months to September 2026)
| Homicide | 0 |
|---|---|
| Violence | 63 |
| Robbery | 13 |
| Theft and burglary | 363 |
| Drugs | 52 |
| Damage and public order | 127 |
| Other | 0 |
Questions about crime in Cheesman Park
- Is Cheesman Park safe?
- Cheesman Park: Safety 4 out of 10 (Above average crime). Compared with 76 places in Denver (10 = lowest crime). 2 places were left out of the comparison (incomplete figures or very few residents).
- What is the crime rate in Cheesman Park?
- Cheesman Park: Weighted crime: 19,251 per 100,000 people (12 months to September 2026).
- How many murders are there in Cheesman Park?
- Recorded homicides in Cheesman Park (12 months to September 2026): 0.