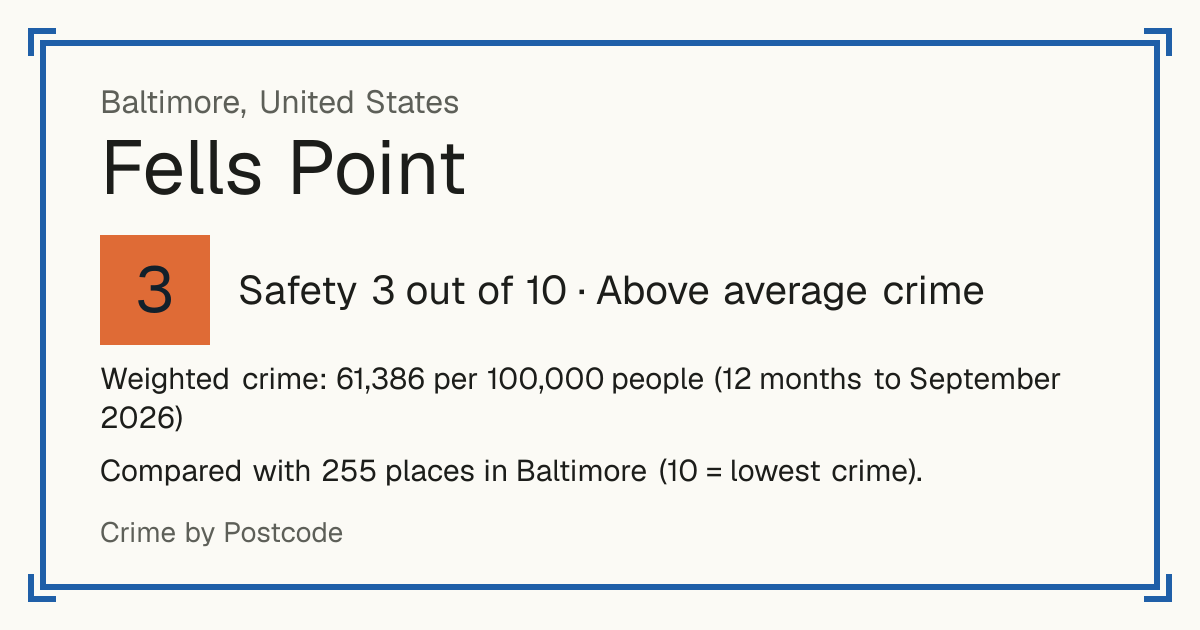
3Fells Point
Fells Point, United States: crime rate and Safety score
Safety 3 out of 10 Above average crime
3/10 in Baltimore · 2/10 in the world
Compared with 255 places in Baltimore (10 = lowest crime). 16 places were left out of the comparison (incomplete figures or very few residents).
Weighted crime: 61,386 per 100,000 people (12 months to September 2026)
Residents: 4,703
How accurate: not enough history to test this score yet.
Crime by type, as recorded by Baltimore Police Department (12 months to September 2026)
| Type | Count | Per 100,000 a year | All places this source covers |
|---|---|---|---|
| Homicide | |||
| Murder and non-negligent manslaughter | 1 | 21.3 | 20.7 |
| Sexual offences | |||
| Rape | 3 | 63.8 | 32.4 |
| Sodomy | 1 | 21.3 | 12.5 |
| Sexual assault with an object | 0 | 0 | 3.8 |
| Fondling | 1 | 21.3 | 29.9 |
| Violence | |||
| Aggravated assault | 46 | 978.1 | 895.5 |
| Common assault | 125 | 2,657.9 | 1,669.7 |
| Robbery | |||
| Robbery | 39 | 829.3 | 485.6 |
| Theft and burglary | |||
| Burglary | 33 | 701.7 | 509 |
| Motor vehicle theft | 36 | 765.5 | 799.4 |
| Shoplifting | 49 | 1,041.9 | 692.9 |
| Theft from a building | 22 | 467.8 | 301.4 |
| Theft from a vehicle | 71 | 1,509.7 | 810.2 |
| Theft of vehicle parts | 10 | 212.6 | 307.5 |
| Other theft | 71 | 1,509.7 | 741.9 |
| Damage and public order | |||
| Vandalism | 81 | 1,722.3 | 1,374.1 |
| Like every row here: Baltimore Police NIBRS records since January 2025, by the neighbourhood the city gives each; crimes against people count once per victim. Drug offences are not in this data. | |||
Source: Baltimore Police Department, updated 28 October 2026.
Recorded crime by type (12 months to September 2026)
| Homicide | 1 |
|---|---|
| Sexual offences | 5 |
| Violence | 171 |
| Robbery | 39 |
| Theft and burglary | 292 |
| Damage and public order | 81 |
Questions about crime in Fells Point
- Is Fells Point safe?
- Fells Point: Safety 3 out of 10 (Above average crime). Compared with 255 places in Baltimore (10 = lowest crime). 16 places were left out of the comparison (incomplete figures or very few residents).
- What is the crime rate in Fells Point?
- Fells Point: Weighted crime: 61,386 per 100,000 people (12 months to September 2026).
- How many murders are there in Fells Point?
- Recorded homicides in Fells Point (12 months to September 2026): 1.