-Back Bay
Back Bay, United States: crime rate and Safety score
Too few places to compare within United States.
1/10 in the world
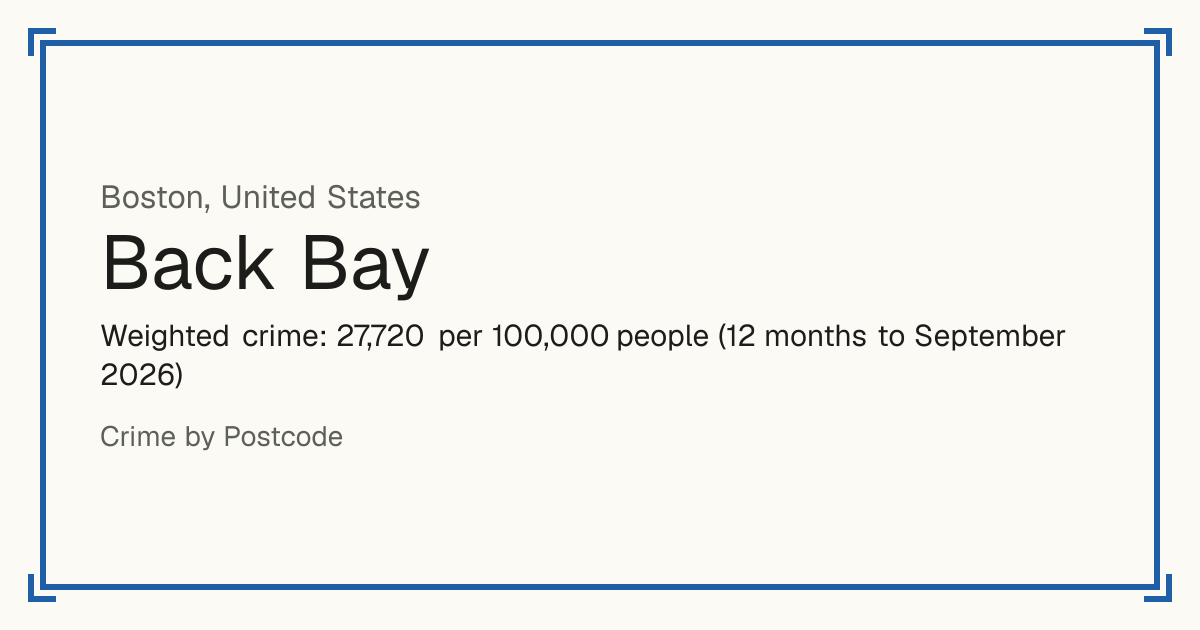
Weighted crime: 27,720 per 100,000 people (12 months to September 2026)
Residents: 18,983
How accurate: not enough history to test this score yet.
Crime by type, as recorded by Boston Police Department (12 months to September 2026)
| Type | Count | Per 100,000 a year | All places this source covers |
|---|---|---|---|
| Homicide | |||
| Murder and non-negligent manslaughter | 1 | 5.3 | 3.5 |
| Violence | |||
| Aggravated assault | 37 | 194.9 | 208.8 |
| Simple assault | 154 | 811.3 | 419.2 |
| Robbery | |||
| Robbery | 26 | 137 | 90.3 |
| Theft and burglary | |||
| Residential burglary | 10 | 52.7 | 63.8 |
| Commercial burglary | 28 | 147.5 | 48 |
| Shoplifting | 1,250 | 6,584.8 | 609.1 |
| Theft from a building | 88 | 463.6 | 267.3 |
| Theft from a vehicle | 37 | 194.9 | 200.3 |
| Theft of vehicle parts | 1 | 5.3 | 31.8 |
| Bicycle theft | 17 | 89.6 | 64.1 |
| Other theft | 38 | 200.2 | 233.1 |
| Motor vehicle theft | 6 | 31.6 | 106.9 |
| Motorcycle and scooter theft | 6 | 31.6 | 55.8 |
| Drugs | |||
| Drug offences | 18 | 94.8 | 330.3 |
| Damage and public order | |||
| Vandalism | 46 | 242.3 | 319.8 |
| Like every row here: Boston Police incident reports placed in neighbourhoods by their map point, by the date of the incident. Sexual offences are not in the open data. | |||
Source: Boston Police Department, updated 28 October 2026.
Recorded crime by type (12 months to September 2026)
| Homicide | 1 |
|---|---|
| Violence | 191 |
| Robbery | 26 |
| Theft and burglary | 1,481 |
| Drugs | 18 |
| Damage and public order | 46 |
Questions about crime in Back Bay
- Is Back Bay safe?
- Back Bay: Too few places to compare within United States.
- What is the crime rate in Back Bay?
- Back Bay: Weighted crime: 27,720 per 100,000 people (12 months to September 2026).
- How many murders are there in Back Bay?
- Recorded homicides in Back Bay (12 months to September 2026): 1.