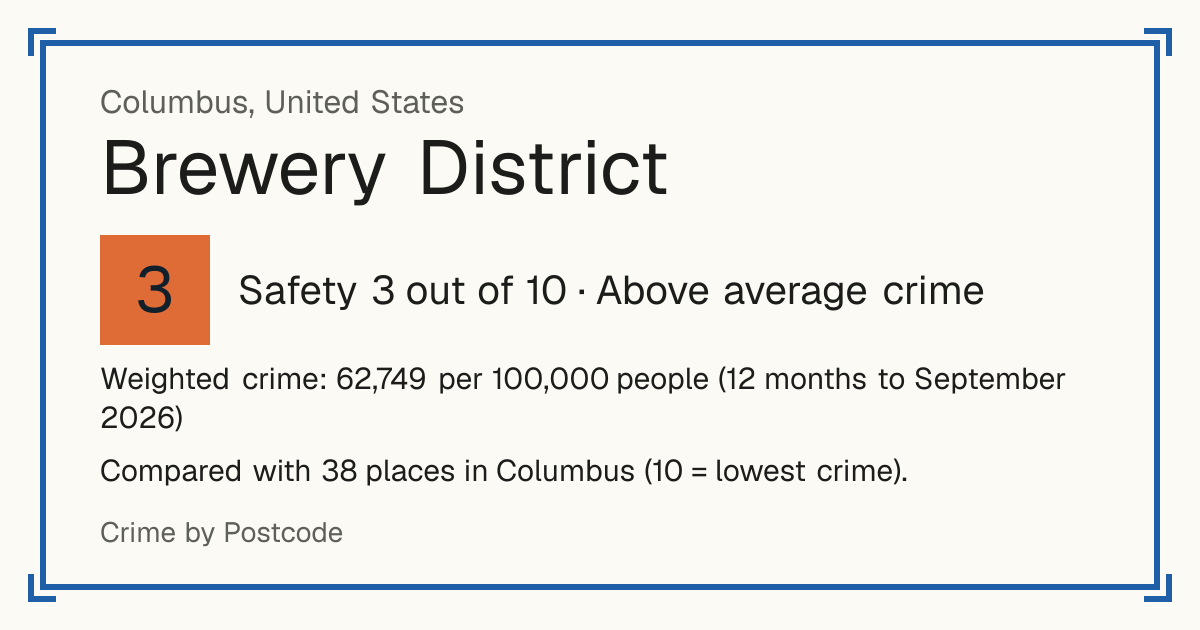
3Brewery District
Brewery District, United States: crime rate and Safety score
Safety 3 out of 10 Above average crime
3/10 in Columbus · 1/10 in the world
Compared with 38 places in Columbus (10 = lowest crime). 2 places were left out of the comparison (incomplete figures or very few residents).
Weighted crime: 62,749 per 100,000 people (12 months to September 2026)
Residents: 1,506
How accurate: in 2026-09, 92% of the 38 neighbourhoods compared scored within 1 of their 2025-09 score.
Crime by type, as recorded by Columbus Division of Police (12 months to September 2026)
| Type | Count | Per 100,000 a year | All places this source covers |
|---|---|---|---|
| Homicide | |||
| Homicide | 0 | 0 | 8.3 |
| Sexual offences | |||
| Rape and sexual assault (victim 16 or older) | 2 | 132.8 | 73.4 |
| Rape and sexual assault (victim 15 or younger) | 0 | 0 | 51.8 |
| Molestation (victim 15 or younger) | 1 | 66.4 | 35.3 |
| Molestation (victim 16 or older) | 0 | 0 | 10.1 |
| Molestation (age not given) | 0 | 0 | 5.4 |
| Violence | |||
| Felony assault | 6 | 398.4 | 87.4 |
| Assault | 21 | 1,394.4 | 471.7 |
| Domestic violence | 13 | 863.2 | 779.3 |
| Ohio's offence of harming, or threatening to harm, a family or household member. | |||
| Menacing (threats) | 10 | 664 | 372.7 |
| Kidnapping | 1 | 66.4 | 6.8 |
| Robbery | |||
| Robbery | 7 | 464.8 | 98.9 |
| Theft and burglary | |||
| Burglary | 5 | 332 | 176.3 |
| Attempted burglary | 0 | 0 | 24.6 |
| Attempts only. | |||
| Breaking and entering | 10 | 664 | 176.7 |
| Ohio's lesser break-in offence, mostly into empty buildings, sheds and garages. | |||
| Theft | 77 | 5,112.9 | 1,401.6 |
| Felony theft | 23 | 1,527.2 | 314.8 |
| Theft of a number plate | 1 | 66.4 | 47 |
| Motor vehicle theft | 10 | 664 | 445.9 |
| Attempted motor vehicle theft | 2 | 132.8 | 97.4 |
| Attempts only. | |||
| Unauthorised use of a motor vehicle | 0 | 0 | 10.4 |
| Drugs | |||
| Drug offences | 2 | 132.8 | 52.6 |
| Damage and public order | |||
| Criminal damage | 31 | 2,058.4 | 584.8 |
| Vandalism | 2 | 132.8 | 11.3 |
| Trespass | 24 | 1,593.6 | 363.2 |
| Disorderly conduct | 1 | 66.4 | 17.3 |
| Other | |||
| Weapons offences | 1 | 66.4 | 63 |
| Arson | 0 | 0 | 2.3 |
Source: Columbus Division of Police, updated 29 October 2026.
Recorded crime by type (12 months to September 2026)
| Homicide | 0 |
|---|---|
| Sexual offences | 3 |
| Violence | 51 |
| Robbery | 7 |
| Theft and burglary | 128 |
| Drugs | 2 |
| Damage and public order | 58 |
| Other | 1 |
Questions about crime in Brewery District
- Is Brewery District safe?
- Brewery District: Safety 3 out of 10 (Above average crime). Compared with 38 places in Columbus (10 = lowest crime). 2 places were left out of the comparison (incomplete figures or very few residents).
- What is the crime rate in Brewery District?
- Brewery District: Weighted crime: 62,749 per 100,000 people (12 months to September 2026).
- How many murders are there in Brewery District?
- Recorded homicides in Brewery District (12 months to September 2026): 0.