Ogden police area, Utah, United States: crime rate and Safety score
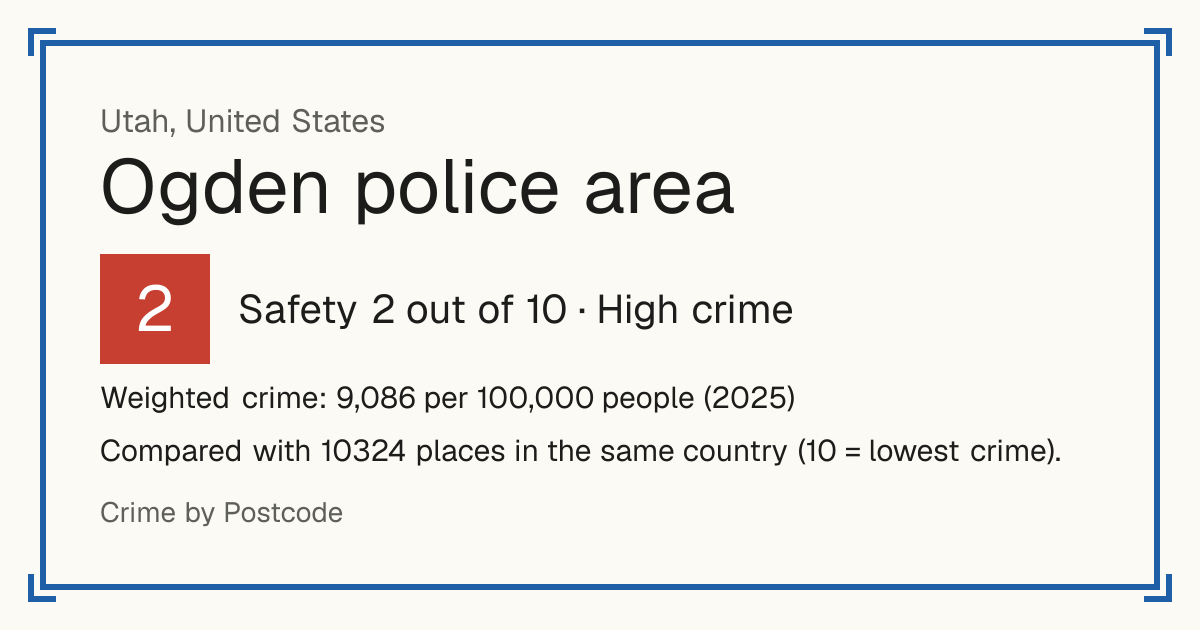
Safety 2 out of 10 High crime
2/10 in United States · 2/10 in the world
Compared with 10324 places in the same country (10 = lowest crime). 767 places were left out of the comparison (incomplete figures or very few residents).
Weighted crime: 9,086 per 100,000 people (2025)
Figures are for the police agency that covers Ogden police area.
Crime by type, as recorded by FBI Crime Data Explorer (2025)
| Type | Count | Per 100,000 a year | All places this source covers |
|---|---|---|---|
| Homicide | |||
| Murder and non-negligent manslaughter | 6 | 6.7 | 4.2 |
| Sexual offences | |||
| Rape | 79 | 88.8 | 36 |
| Violence | |||
| Aggravated assault | 264 | 296.6 | 238.3 |
| FBI summary counts: only aggravated assault, not simple assault. | |||
| Robbery | |||
| Robbery | 48 | 53.9 | 50.4 |
| Theft and burglary | |||
| Burglary | 144 | 161.8 | 190.5 |
| Larceny-theft | 1,169 | 1,313.5 | 1,141 |
| Motor vehicle theft | 122 | 137.1 | 197.5 |
| Other | |||
| Arson | 13 | 14.6 | 9.1 |
Source: FBI Crime Data Explorer, updated 28 October 2026.
Recorded crime by type (2025)
| Homicide | 6 |
|---|---|
| Sexual offences | 79 |
| Violence | 264 |
| Robbery | 48 |
| Theft and burglary | 1,435 |
| Other | 13 |
Questions about crime in Ogden police area
- Is Ogden police area safe?
- Ogden police area: Safety 2 out of 10 (High crime). Compared with 10324 places in the same country (10 = lowest crime). 767 places were left out of the comparison (incomplete figures or very few residents).
- What is the crime rate in Ogden police area?
- Ogden police area: Weighted crime: 9,086 per 100,000 people (2025).
- How many murders are there in Ogden police area?
- Recorded homicides in Ogden police area (2025): 6.
Other places nearby
Sheriffs of Weber County since 2010
Ogden: Mayor not loaded yet. Weber County: Sheriff Ryan Arbon (Republican). Governor: Spencer Cox (Republican)
Ryan Arbon · Republican
since 2022
Weber County ▼ −40% · USA ▼ −20%
Offences reported to the FBI per 1,000 people, the year before the term vs its latest year
Ryan Arbon
2018 – 2022
Weber County ▼ −29% · USA ▼ −3%
Offences reported to the FBI per 1,000 people, the year before the term vs its latest year
Terry Thompson · Republican
2014 – 2018
Weber County ▲ +7% · USA ▼ −9%
Offences reported to the FBI per 1,000 people, the year before the term vs its latest year
Terry Thompson · Republican
2010 – 2014
Weber County ▼ −43% · USA ▼ −12%
Offences reported to the FBI per 1,000 people, the year before the term vs its latest year
In some cities an appointed manager or police chief, not the mayor, runs the police; in some counties the sheriff mainly runs the jail and the courts.
Mayors: Hilbig, Archived Campaign Websites of U.S. Mayoral Candidates (CC BY 4.0) and city sites. Sheriffs: Mavridis, US Sheriff Election Data (CC BY 4.0), MIT Election Data + Science Lab (CC0) and county election offices. Crime: FBI Crime Data Explorer.