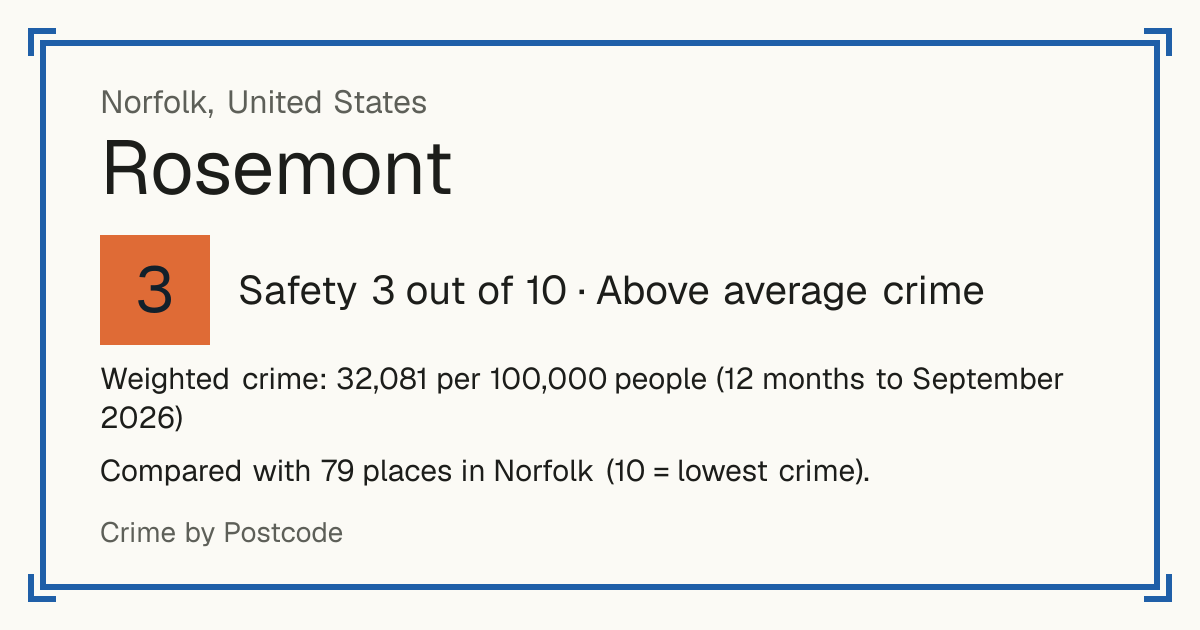
3Rosemont
Rosemont, Norfolk, United States: crime rate and Safety score
Safety 3 out of 10 Above average crime
3/10 in Norfolk · 2/10 in the world
Compared with 79 places in Norfolk (10 = lowest crime). 7 places were left out of the comparison (incomplete figures or very few residents).
Weighted crime: 32,081 per 100,000 people (12 months to September 2026)
Residents: 4,420
How accurate: in 2026-09, 81% of the 78 neighbourhoods compared scored within 1 of their 2025-09 score.
Crime by type, as recorded by Norfolk Police Department (12 months to September 2026)
| Type | Count | Per 100,000 a year | All places this source covers |
|---|---|---|---|
| Homicide | |||
| Homicide | 2 | 45.2 | 13 |
| Sexual offences | |||
| Rape | 2 | 45.2 | 23.1 |
| Forcible sodomy | 0 | 0 | 10.5 |
| Sexual penetration with an object | 0 | 0 | 5 |
| Aggravated sexual battery | 0 | 0 | 7.6 |
| Sexual battery | 2 | 45.2 | 36.1 |
| Violence | |||
| Aggravated assault | 1 | 22.6 | 60.1 |
| Aggravated assault (domestic) | 2 | 45.2 | 49.2 |
| Simple assault | 30 | 678.7 | 589.5 |
| Simple assault (domestic) | 41 | 927.6 | 640.4 |
| Assault on a police officer | 0 | 0 | 17.2 |
| Threats of bodily harm | 5 | 113.1 | 116.4 |
| Abduction | 1 | 22.6 | 16.4 |
| Robbery | |||
| Robbery of a person | 3 | 67.9 | 39.9 |
| Robbery of a business | 0 | 0 | 12.6 |
| Carjacking | 0 | 0 | 5 |
| Theft and burglary | |||
| Burglary of a home | 4 | 90.5 | 77.7 |
| Burglary of a business | 3 | 67.9 | 38.2 |
| Burglary of other buildings | 0 | 0 | 26.9 |
| Vehicle theft | 21 | 475.1 | 252.5 |
| Theft from a vehicle | 53 | 1,199.1 | 726.1 |
| Theft of vehicle parts | 12 | 271.5 | 162.2 |
| Theft from a building | 16 | 362 | 274.4 |
| Shoplifting | 2 | 45.2 | 805.1 |
| Bicycle theft | 2 | 45.2 | 36.6 |
| Other theft | 13 | 294.1 | 332.4 |
| Drugs | |||
| Drug offences (felony) | 4 | 90.5 | 81.1 |
| Drug offences | 3 | 67.9 | 74.4 |
| Drug paraphernalia | 2 | 45.2 | 11.8 |
| Damage and public order | |||
| Vandalism | 31 | 701.4 | 609.7 |
| Trespassing | 2 | 45.2 | 63 |
| Disorderly conduct | 0 | 0 | 13.9 |
| Other | |||
| Weapons offences | 4 | 90.5 | 42.9 |
| Carrying a concealed weapon | 1 | 22.6 | 27.7 |
| Brandishing a firearm | 4 | 90.5 | 60.1 |
| Shooting into an occupied home | 2 | 45.2 | 31.1 |
| Arson | 0 | 0 | 4.2 |
Source: Norfolk Police Department, updated 29 October 2026.
Recorded crime by type (12 months to September 2026)
| Homicide | 2 |
|---|---|
| Sexual offences | 4 |
| Violence | 80 |
| Robbery | 3 |
| Theft and burglary | 126 |
| Drugs | 9 |
| Damage and public order | 33 |
| Other | 11 |
Questions about crime in Rosemont
- Is Rosemont safe?
- Rosemont: Safety 3 out of 10 (Above average crime). Compared with 79 places in Norfolk (10 = lowest crime). 7 places were left out of the comparison (incomplete figures or very few residents).
- What is the crime rate in Rosemont?
- Rosemont: Weighted crime: 32,081 per 100,000 people (12 months to September 2026).
- How many murders are there in Rosemont?
- Recorded homicides in Rosemont (12 months to September 2026): 2.