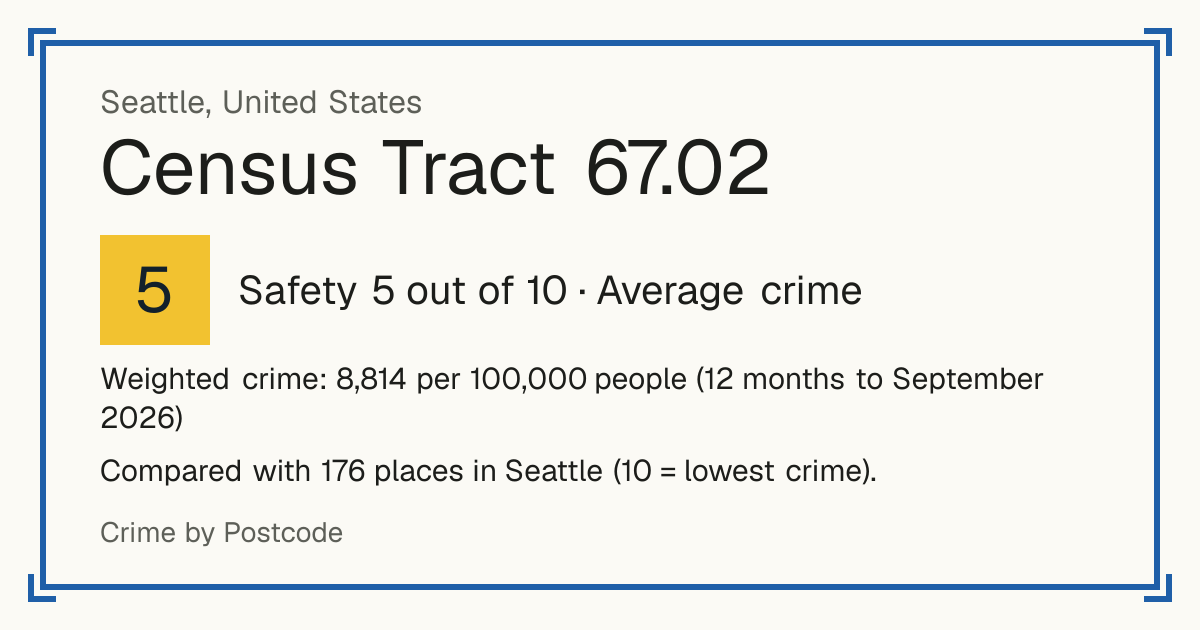
5Census Tract 67.02
Census Tract 67.02, Seattle, United States: crime rate and Safety score
Safety 5 out of 10 Average crime
5/10 in Seattle · 3/10 in the world
Compared with 176 places in Seattle (10 = lowest crime). 1 places were left out of the comparison (incomplete figures or very few residents).
Weighted crime: 8,814 per 100,000 people (12 months to September 2026)
Residents: 3,256
How accurate: in 2026-09, 93% of the 176 neighbourhoods compared scored within 1 of their 2025-09 score.
Crime by type, as recorded by Seattle Police Department (12 months to September 2026)
| Type | Count | Per 100,000 a year | All places this source covers |
|---|---|---|---|
| Robbery | |||
| Robbery | 0 | 0 | 152.1 |
| About one robbery in eight has its location withheld by the police and is not counted in any tract. | |||
| Theft and burglary | |||
| Burglary | 26 | 798.5 | 939.2 |
| Theft from a vehicle | 54 | 1,658.5 | 1,079.6 |
| Theft of vehicle parts | 10 | 307.1 | 350.1 |
| Motor vehicle theft | 19 | 583.5 | 636.6 |
| Shoplifting | 1 | 30.7 | 391.4 |
| Theft from a building | 4 | 122.9 | 272.6 |
| Other theft | 21 | 645 | 679.6 |
| Drugs | |||
| Drug offences | 1 | 30.7 | 205.1 |
| Damage and public order | |||
| Vandalism and property damage | 15 | 460.7 | 698.6 |
| Like every row here: Seattle Police offences placed in census tracts by their census block. Assaults, homicides and sexual offences are left out: the police withhold the location of most of them. | |||
Source: Seattle Police Department, updated 28 October 2026.
Recorded crime by type (12 months to September 2026)
| Robbery | 0 |
|---|---|
| Theft and burglary | 135 |
| Drugs | 1 |
| Damage and public order | 15 |
Questions about crime in Census Tract 67.02
- Is Census Tract 67.02 safe?
- Census Tract 67.02: Safety 5 out of 10 (Average crime). Compared with 176 places in Seattle (10 = lowest crime). 1 places were left out of the comparison (incomplete figures or very few residents).
- What is the crime rate in Census Tract 67.02?
- Census Tract 67.02: Weighted crime: 8,814 per 100,000 people (12 months to September 2026).