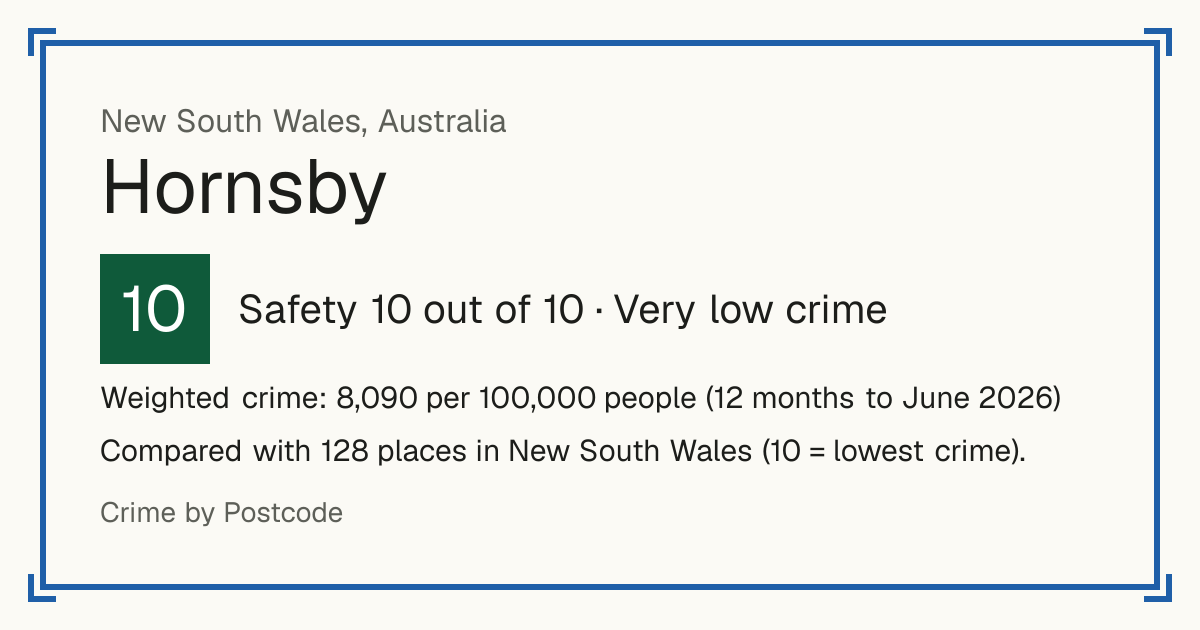
10Hornsby
Hornsby, New South Wales, Australia: crime rate and Safety score
Safety 10 out of 10 Very low crime
10/10 in New South Wales · 10/10 in the world
Compared with 128 places in New South Wales (10 = lowest crime).
Weighted crime: 8,090 per 100,000 people (12 months to June 2026)
Crime by type, as recorded by BOCSAR (12 months to June 2026)
| Type | Count | Per 100,000 a year | All places this source covers |
|---|---|---|---|
| Homicide | |||
| Homicide | 0 | 0 | 1.3 |
| Sexual offences | |||
| Sexual offences | 176 | 113.2 | 238.8 |
| Violence | |||
| Assault | 501 | 322.2 | 872.4 |
| Includes domestic violence related assault. | |||
| Robbery | |||
| Robbery | 17 | 10.9 | 20.1 |
| Theft and burglary | |||
| Theft, including break and enter | 1,536 | 987.9 | 2,125.6 |
| Drugs | |||
| Drug offences | 229 | 147.3 | 484 |
| Damage and public order | |||
| Malicious damage to property | 382 | 245.7 | 560.6 |
Source: BOCSAR, updated 28 October 2026.
Recorded crime by type (12 months to June 2026)
| Homicide | 0 |
|---|---|
| Sexual offences | 176 |
| Violence | 501 |
| Robbery | 17 |
| Theft and burglary | 1,536 |
| Drugs | 229 |
| Damage and public order | 382 |
Questions about crime in Hornsby
- Is Hornsby safe?
- Hornsby: Safety 10 out of 10 (Very low crime). Compared with 128 places in New South Wales (10 = lowest crime).
- What is the crime rate in Hornsby?
- Hornsby: Weighted crime: 8,090 per 100,000 people (12 months to June 2026).
- How many murders are there in Hornsby?
- Recorded homicides in Hornsby (12 months to June 2026): 0.
Other places nearby
- The Hills 10/10
- Ku-ring-gai 10/10
- Northern Beaches 10/10
- Ryde 10/10
- Willoughby 9/10
- Lane Cove 10/10
- Parramatta 7/10
- Hunters Hill 10/10