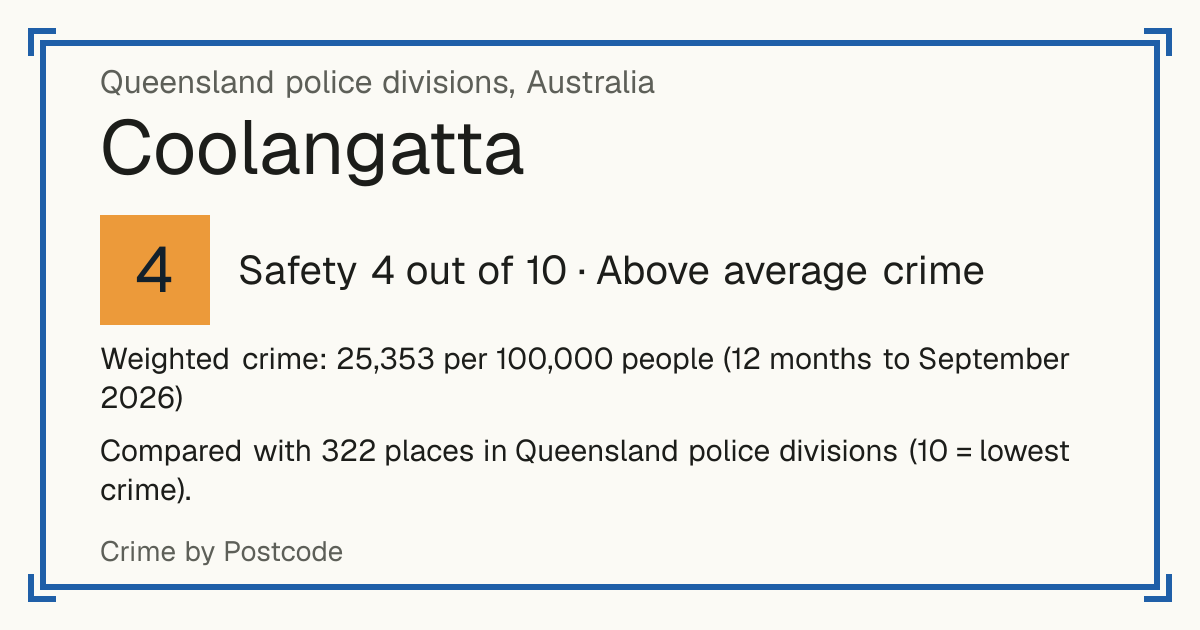
4Coolangatta
Coolangatta, Queensland police divisions, Australia: crime rate and Safety score
Safety 4 out of 10 Above average crime
4/10 in Queensland police divisions · 7/10 in the world
Compared with 322 places in Queensland police divisions (10 = lowest crime). 12 places were left out of the comparison (incomplete figures or very few residents).
Weighted crime: 25,353 per 100,000 people (12 months to September 2026)
Residents: 28,395
How accurate: not enough history to test this score yet.
Crime by type, as recorded by Queensland Police Service (12 months to September 2026)
| Type | Count | Per 100,000 a year | All places this source covers |
|---|---|---|---|
| Homicide | |||
| Murder | 1 | 3.5 | 0.6 |
| Other homicide | 0 | 0 | 1.5 |
| Includes attempted murder, conspiracy to murder and manslaughter. | |||
| Sexual offences | |||
| Sexual offences | 42 | 147.9 | 216.5 |
| Violence | |||
| Assault | 185 | 651.5 | 1,046.5 |
| Robbery | |||
| Robbery | 11 | 38.7 | 44.5 |
| Theft and burglary | |||
| Break-in | 244 | 859.3 | 665.3 |
| Unlawful use of a motor vehicle | 204 | 718.4 | 335.6 |
| Other theft | 1,032 | 3,634.4 | 2,648 |
| Drugs | |||
| Drug offences | 496 | 1,746.8 | 1,721.2 |
| Damage and public order | |||
| Property damage | 198 | 697.3 | 723.4 |
| Public order offences | 171 | 602.2 | 781.8 |
Source: Queensland Police Service, updated 28 October 2026.
Recorded crime by type (12 months to September 2026)
| Homicide | 1 |
|---|---|
| Sexual offences | 42 |
| Violence | 185 |
| Robbery | 11 |
| Theft and burglary | 1,480 |
| Drugs | 496 |
| Damage and public order | 369 |
Questions about crime in Coolangatta
- Is Coolangatta safe?
- Coolangatta: Safety 4 out of 10 (Above average crime). Compared with 322 places in Queensland police divisions (10 = lowest crime). 12 places were left out of the comparison (incomplete figures or very few residents).
- What is the crime rate in Coolangatta?
- Coolangatta: Weighted crime: 25,353 per 100,000 people (12 months to September 2026).
- How many murders are there in Coolangatta?
- Recorded homicides in Coolangatta (12 months to September 2026): 1.