2Malvern East
Malvern East, Australia: crime rate and Safety score
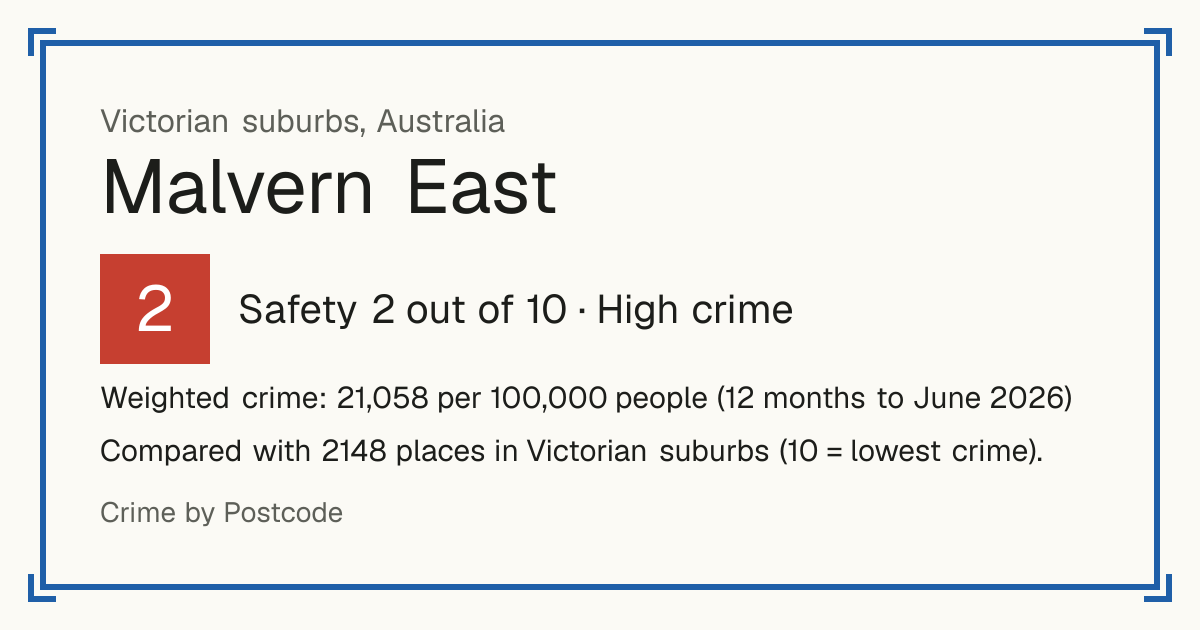
Safety 2 out of 10 High crime
2/10 in Victorian suburbs · 7/10 in the world
Compared with 2148 places in Victorian suburbs (10 = lowest crime). 92 places were left out of the comparison (incomplete figures or very few residents).
Weighted crime: 21,058 per 100,000 people (12 months to June 2026)
Residents: 22,296
How accurate: not enough history to test this score yet.
Crime by type, as recorded by Crime Statistics Agency Victoria (12 months to June 2026)
| Type | Count | Per 100,000 a year | All places this source covers |
|---|---|---|---|
| Violence | |||
| Assault and related offences | 114 | 511.3 | 724.5 |
| Victoria counts criminal incidents: one incident can include several offences. | |||
| Robbery | |||
| Robbery | 14 | 62.8 | 37 |
| Theft and burglary | |||
| Burglary and break-in | 161 | 722.1 | 568.1 |
| Theft | 1,449 | 6,498.9 | 2,966.2 |
| Victoria counts criminal incidents: one incident can include several offences. | |||
| Drugs | |||
| Drug dealing and trafficking | 4 | 17.9 | 35.9 |
| Growing or making drugs | 5 | 22.4 | 29.5 |
| Drug use and possession | 24 | 107.6 | 174.9 |
| Other drug offences | 0 | 0 | 0.1 |
| Damage and public order | |||
| Property damage | 121 | 542.7 | 611.5 |
| Disorderly and offensive conduct | 16 | 71.8 | 53.5 |
| Public nuisance offences | 20 | 89.7 | 46.5 |
Source: Crime Statistics Agency Victoria, updated 28 October 2026.
Recorded crime by type (12 months to June 2026)
| Violence | 114 |
|---|---|
| Robbery | 14 |
| Theft and burglary | 1,610 |
| Drugs | 33 |
| Damage and public order | 157 |
Questions about crime in Malvern East
- Is Malvern East safe?
- Malvern East: Safety 2 out of 10 (High crime). Compared with 2148 places in Victorian suburbs (10 = lowest crime). 92 places were left out of the comparison (incomplete figures or very few residents).
- What is the crime rate in Malvern East?
- Malvern East: Weighted crime: 21,058 per 100,000 people (12 months to June 2026).