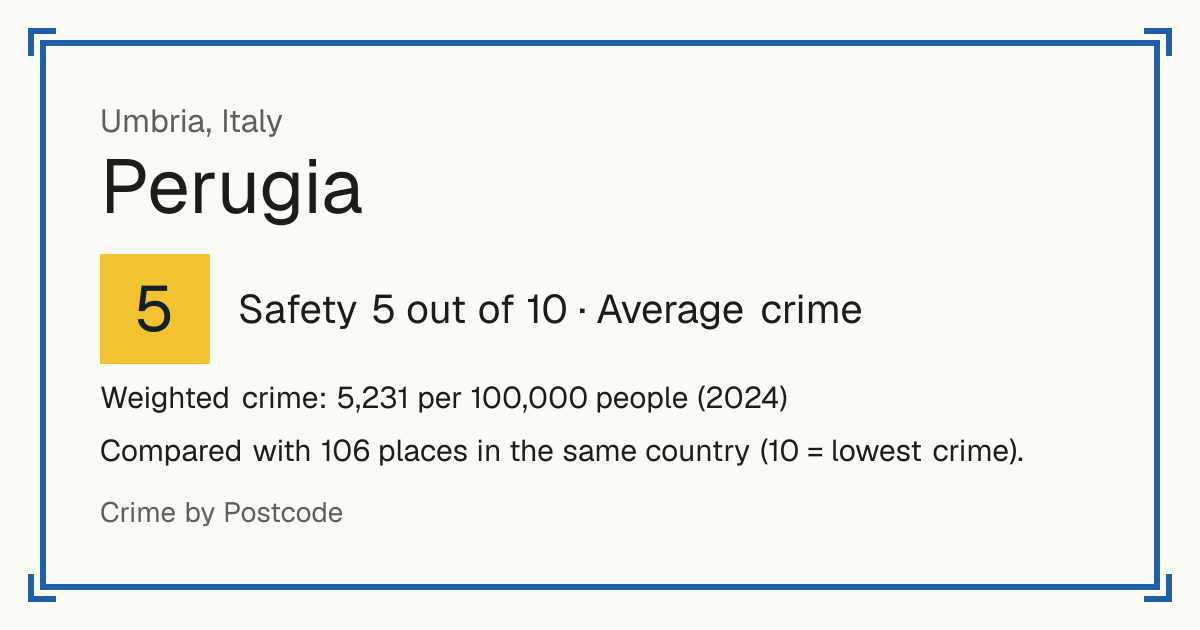
5Perugia
Perugia, Italy: crime rate and Safety score
Safety 5 out of 10 Average crime
5/10 in Italy · 8/10 in the world
Compared with 106 places in the same country (10 = lowest crime).
Weighted crime: 5,231 per 100,000 people (2024)
Crime by type, as recorded by Istat (2024)
| Type | Count | Per 100,000 a year | All places this source covers |
|---|---|---|---|
| Homicide | |||
| Intentional homicide | 2 | 0.3 | 0.6 |
| Sexual offences | |||
| Sexual violence | 72 | 11.3 | 11.6 |
| Sexual acts with a minor | 5 | 0.8 | 1 |
| Violence | |||
| Intentional injury | 840 | 131.8 | 114.2 |
| Assault without injury | 221 | 34.7 | 30.8 |
| Kidnapping | 4 | 0.6 | 1.2 |
| Robbery | |||
| Robbery | 172 | 27 | 49 |
| Theft and burglary | |||
| Theft, all kinds | 8,142 | 1,277.7 | 1,797.9 |
| Drugs | |||
| Drug production, trafficking and illegal holding | 305 | 47.9 | 56.5 |
| Damage and public order | |||
| Criminal damage | 2,619 | 411 | 473.9 |
| Damage by arson | 54 | 8.5 | 12.7 |
Source: Istat, updated 26 October 2026.
Recorded crime by type (2024)
| Homicide | 2 |
|---|---|
| Sexual offences | 77 |
| Violence | 1,065 |
| Robbery | 172 |
| Theft and burglary | 8,142 |
| Drugs | 305 |
| Damage and public order | 2,673 |
Living
5/10 Living 5 out of 10, compared with other places in the same country.
Raw score 9.8 out of 10, before ranking.
- Schools: 10/10
- Transport: 10/10
- Health: 9/10
- Supermarkets: 10/10
Nearest places
- School: Scuola Media Statale "San Paolo" surcursale 250 m
- School: Scuola Primaria Ariodante Fabretti 260 m
- School: Liceo Classico Mariotti 320 m
- School: Liceo Classico e Musicale Annibale Mariotti 340 m
- School: Scuola Secondaria di Primo Grado "Ugo Foscolo" 400 m
- Bus stop: Piazza Cavallotti 100 m
- Bus stop 110 m
- Bus stop 220 m
- Railway station: Pincetto 250 m
- Doctor or clinic: CEMER – Centro Europeo per la Medicina e la Ricerca 1.1 km
- A&E: Ospedale Santa Maria della Misericordia 4.7 km
- Supermarket: Coop 120 m
- Supermarket: Emi 480 m
Schools count by distance only: there are no inspection grades to use.
Other places nearby
- Terni 5/10