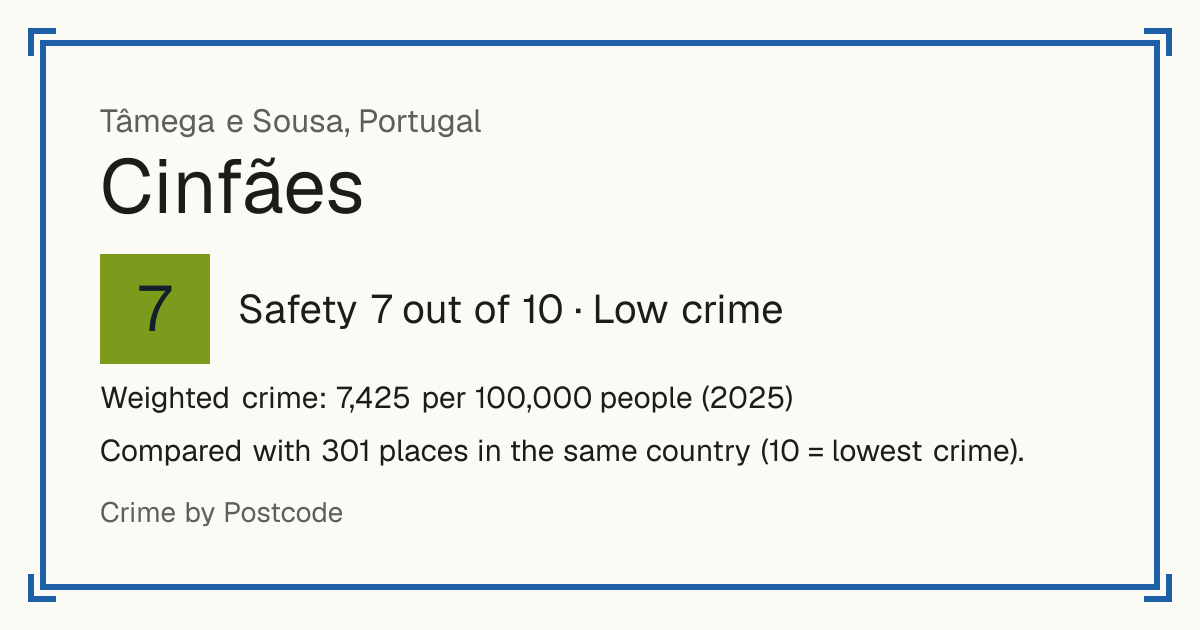
7Cinfães
Cinfães, Portugal: crime rate and Safety score
Safety 7 out of 10 Low crime
7/10 in Portugal · 8/10 in the world
Compared with 301 places in the same country (10 = lowest crime). 5 places were left out of the comparison (incomplete figures or very few residents).
Weighted crime: 7,425 per 100,000 people (2025)
Crime by type, as recorded by INE / DGPJ (2025)
| Type | Count | Per 100,000 a year | All places this source covers |
|---|---|---|---|
| Violence | |||
| Crimes against physical integrity | 95 | 542.2 | 500.6 |
| Theft and burglary | |||
| Crimes against property | 118 | 673.5 | 1,499.7 |
| Includes theft, robbery, burglary, damage and fraud. | |||
| Damage and public order | |||
| Crimes against life in society | 115 | 656.4 | 361.4 |
| Includes drink driving, forgery and arson. The three totals cover about 80% of recorded crime. | |||
Source: INE / DGPJ, updated 28 October 2026.
Recorded crime by type (2025)
| Violence | 95 |
|---|---|
| Theft and burglary | 118 |
| Damage and public order | 115 |
Questions about crime in Cinfães
- Is Cinfães safe?
- Cinfães: Safety 7 out of 10 (Low crime). Compared with 301 places in the same country (10 = lowest crime). 5 places were left out of the comparison (incomplete figures or very few residents).
- What is the crime rate in Cinfães?
- Cinfães: Weighted crime: 7,425 per 100,000 people (2025).
Living
3/10 Living 3 out of 10, compared with other places in the same country.
Raw score 2.9 out of 10, before ranking.
- Schools: 1/10
- Transport: 1/10
- Health: 6/10
- Supermarkets: 5/10
Nearest places
- Doctor or clinic: Centro de Saúde de Oliveira do Douro 7.9 km
- A&E: Centro de Atendimento Permanente Cinfães (Hospital) 4.2 km
- Supermarket: Supermercado Costa 3.9 km
- Supermarket: Auchan Supermercado 4.1 km
Schools count by distance only: there are no inspection grades to use.
Other places nearby
- Marco de Canaveses 8/10
- Resende 7/10
- Baião 9/10
- Castelo de Paiva 10/10
- Penafiel 9/10
- Amarante 9/10
- Lousada 9/10
- Felgueiras 8/10