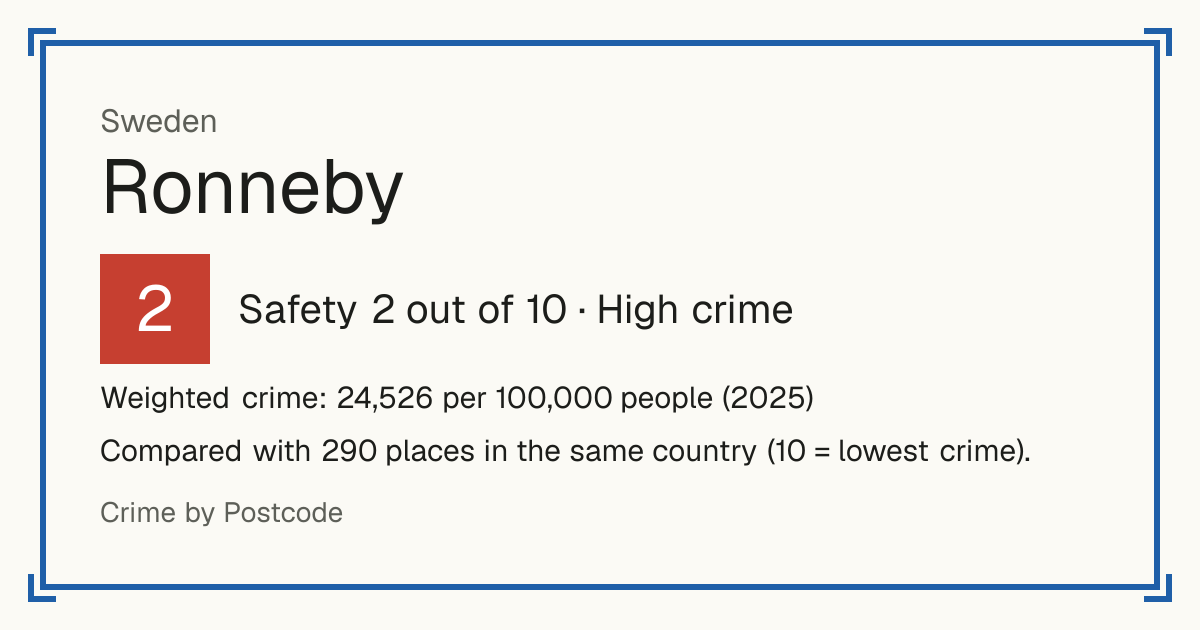
2Ronneby
Ronneby, Sweden: crime rate and Safety score
Safety 2 out of 10 High crime
2/10 in Sweden · 7/10 in the world
Compared with 290 places in the same country (10 = lowest crime).
Weighted crime: 24,526 per 100,000 people (2025)
Crime by type, as recorded by Brå (2025)
| Type | Count | Per 100,000 a year | All places this source covers |
|---|---|---|---|
| Sexual offences | |||
| Sexual offences | 56 | 195.1 | 205.1 |
| Violence | |||
| Attempted murder or manslaughter | 2 | 7 | 9.6 |
| Attempts only: completed homicides are not published by kommun. | |||
| Assault, including aggravated | 290 | 1,010.2 | 827.4 |
| Robbery | |||
| Robbery, including aggravated | 14 | 48.8 | 32.4 |
| Theft and burglary | |||
| Home burglary | 205 | 714.1 | 476.4 |
| Vehicle theft | 27 | 94.1 | 86.6 |
| Bicycle theft | 104 | 362.3 | 540.8 |
| Other theft | 556 | 1,936.7 | 1,462.3 |
| Drugs | |||
| Drug offences | 148 | 515.5 | 1,090.6 |
| Damage and public order | |||
| Criminal damage | 236 | 822.1 | 1,602.1 |
| Public order offences | 32 | 111.5 | 61.3 |
| Other | |||
| Fraud and dishonesty | 541 | 1,884.5 | 1,864.5 |
Source: Brå, updated 26 October 2026.
Recorded crime by type (2025)
| Sexual offences | 56 |
|---|---|
| Violence | 292 |
| Robbery | 14 |
| Theft and burglary | 892 |
| Drugs | 148 |
| Damage and public order | 268 |
| Other | 541 |
Living
3/10 Living 3 out of 10, compared with other places in the same country.
Raw score 1.8 out of 10, before ranking.
- Schools: 1/10
- Transport: 1/10
- Health: 3/10
- Supermarkets: 3/10
Nearest places
- A&E: Blekingesjukhuset Karlskrona 26.8 km
- Supermarket: ICA Nära Träffpunkten 7.0 km
- Supermarket: Coop Kallinge 9.6 km
Schools count by distance only: there are no inspection grades to use.